Analysis Results & Interpretation
This guide provides a detailed walkthrough of every result generated by olinkWrappeR, including guidance on how to interpret the data and the specific requirements for each step. To generate the results, we have used datasets from OlinkAnalyze test data and one research data.
OlinkAnalyze test data
The OlinkAnalyze test data can be downloaded from olinkRPackage GitHub repository.
Research data is not available for public use.
A. Data Preview
A.1 Exclude QC warnings samples
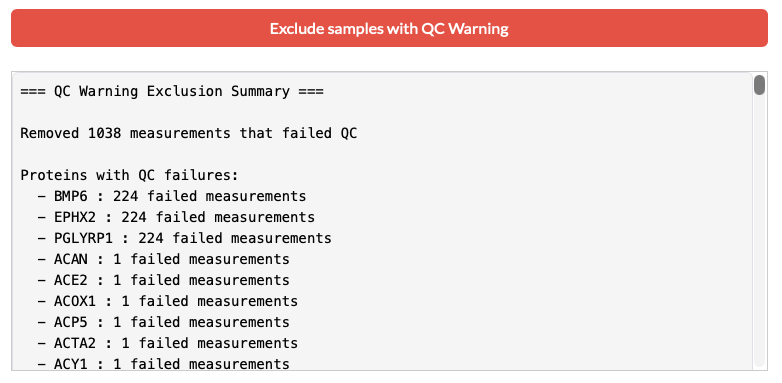
Olink assays include internal controls (incubation, extension, and detection). Samples that deviate significantly from expected values receive a "Warning" flag. Using this "Exclude samples with QC warnings" removes potentially unreliable data before any statistical processing begins.
The window below shows each proteins with number of failed measuments and removed them from the merged dataset. The following databaset will be used for the next step.
Revert the QC warning exclusion
If you want to revert the QC warning exclusion, you can click the "Merge NPX & Var" button in the sidebar again. This will get back to full dataset including the QC warning samples.
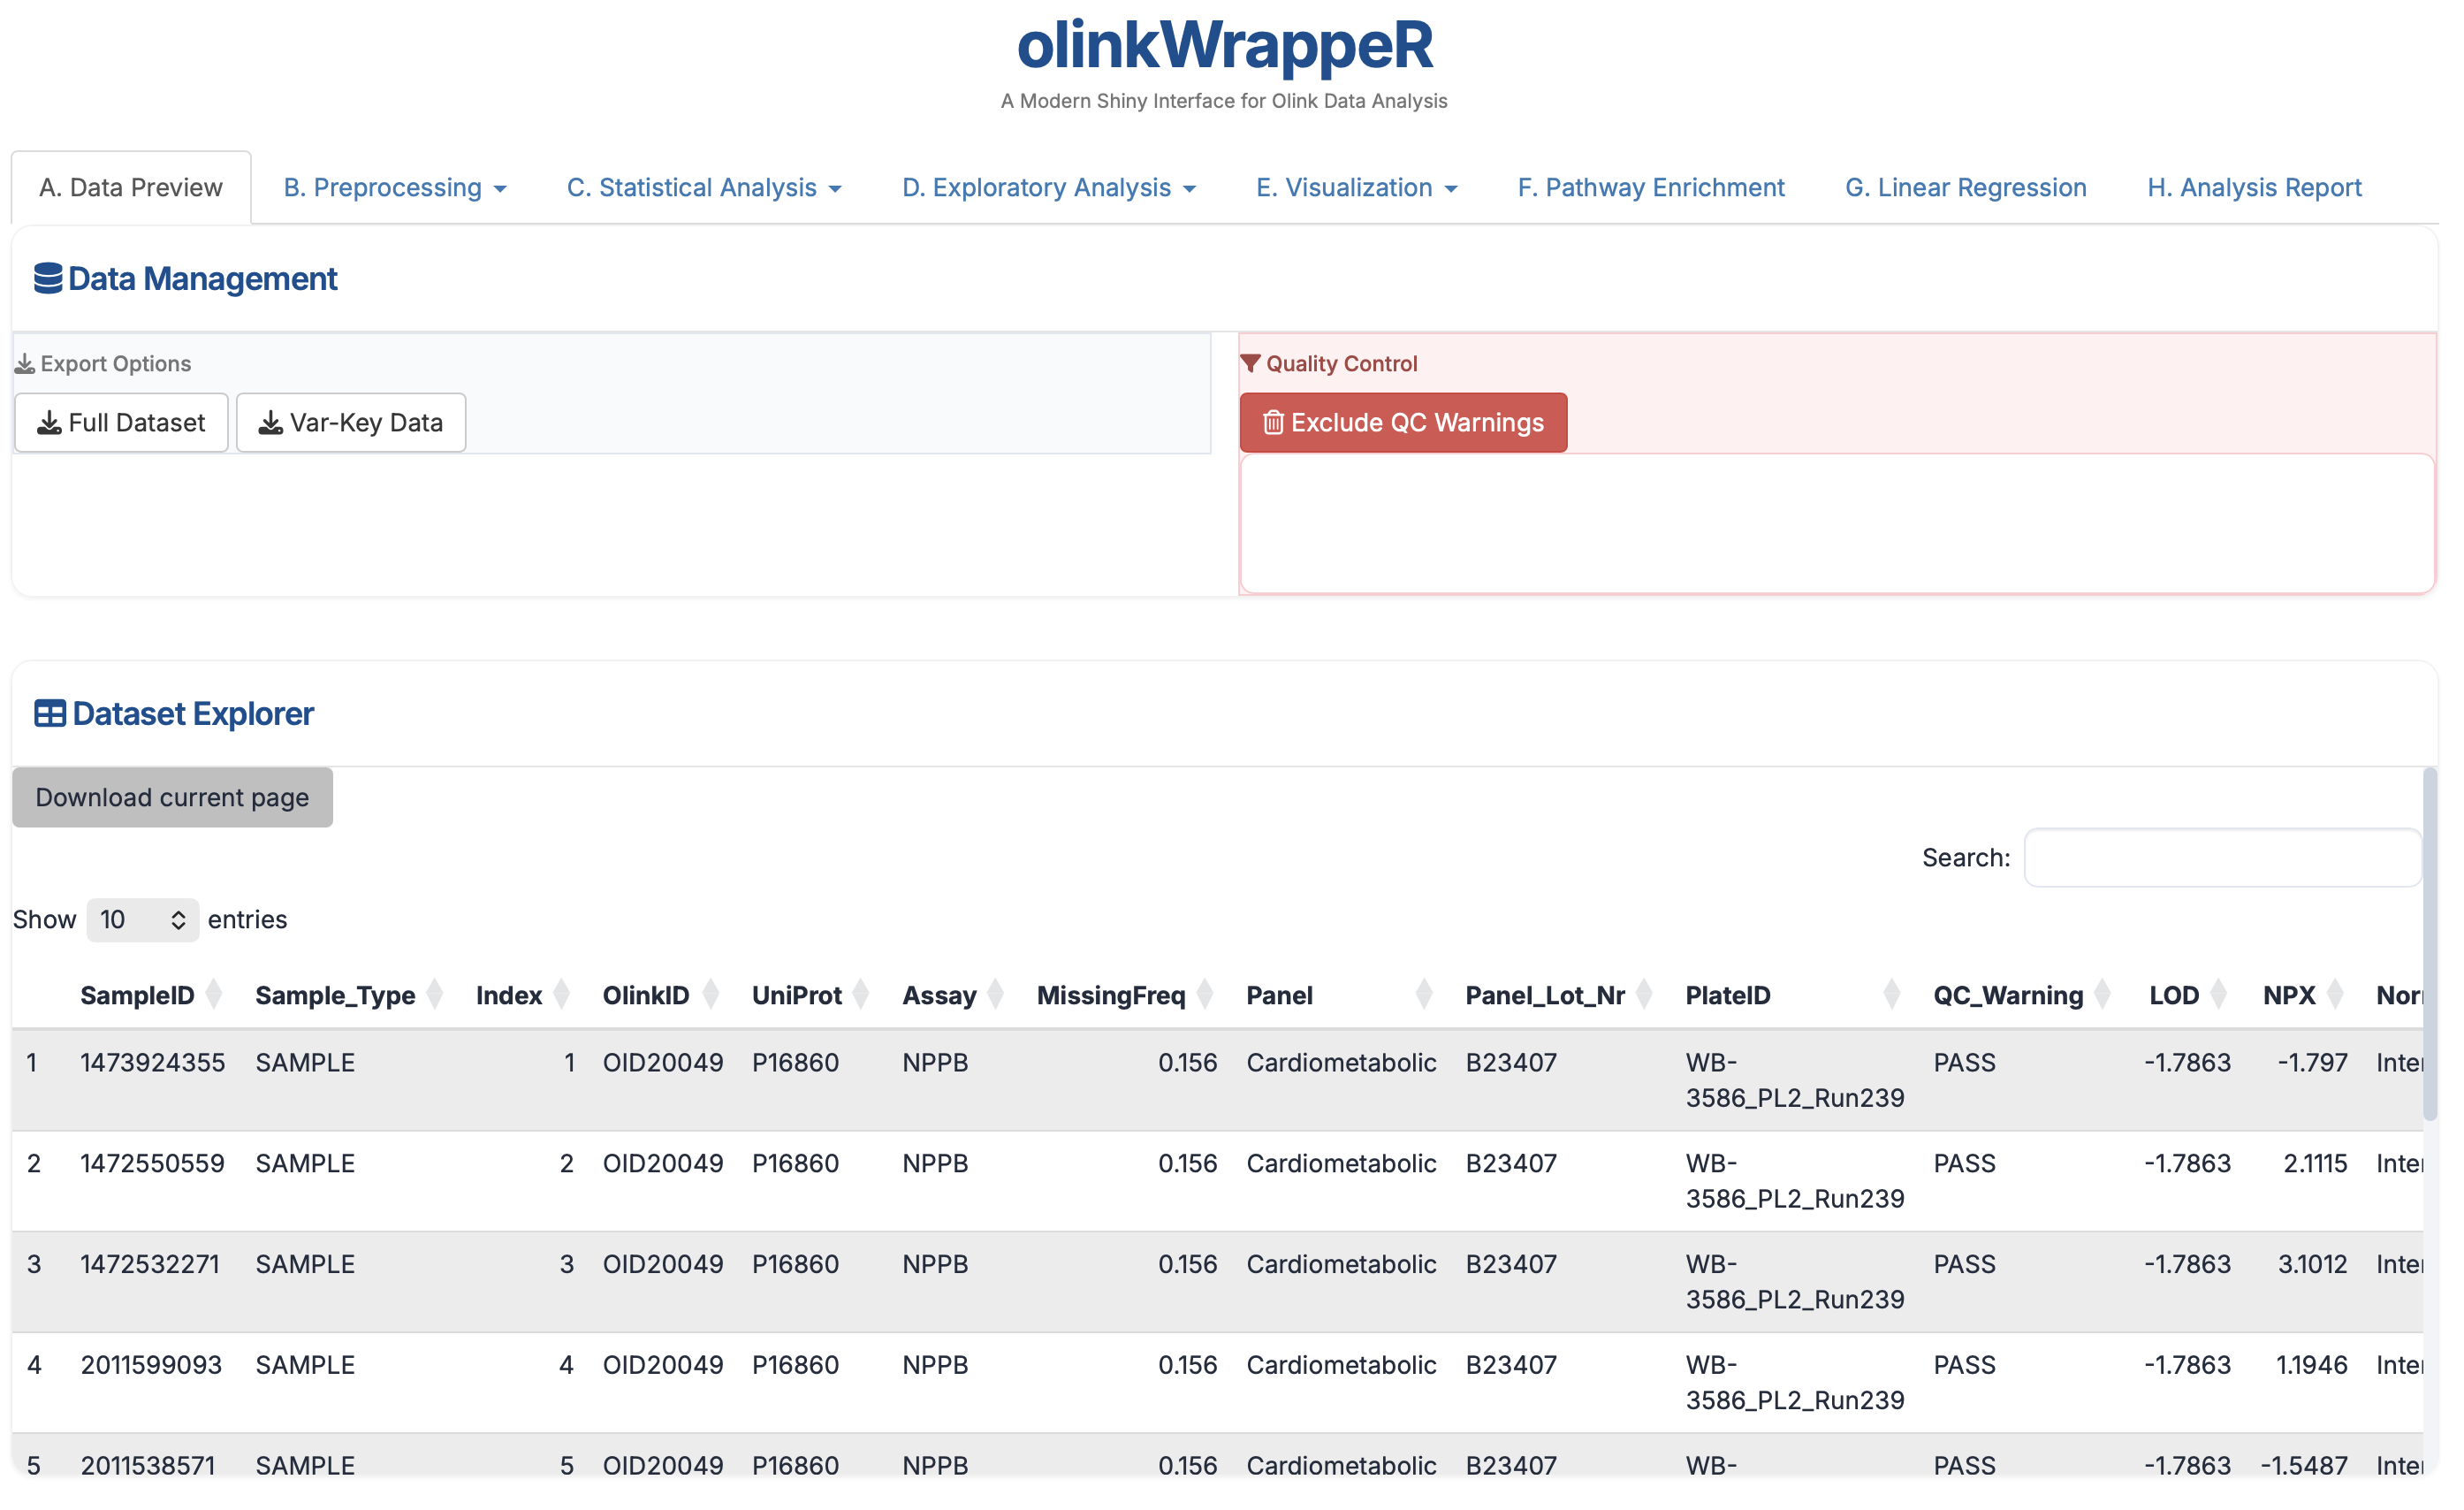
A.2 Dataset Explorer
A searchable, filterable grid of your entire merged dataset, NPX data and the variables file (also the key file if provided). This allows you to verify that the NPX data, Key file, and Variables file merged correctly. Use the search bar for a specific Assay or SampleID to check individual NPX values.
Column description
This file is merged dataset of NPX data and the variables file (also the key file if provided). It contains all columns from NPX data and the variables file (also the key file if provided). There might be duplicate columns if the variables file contains the same column names as the NPX data.
SampleID: Sample names or IDs (e.g, A1, A2, B1, B2, etc.).Index: The index of the sample (e.g, 1, 2, 3, etc.).OlinkID: Unique ID for each assay assigned by Olink. In case the assay is included in more than one panels it will have a different OlinkID in each one.(e.g., OID0126, OID0127, etc.).UniProt: The UniProt identifier (e.g., P0126, P0127, etc.).Assay: Common gene name for the assay (e.g., CHL1, NRP1, PLXNB2, etc.).MissingFreq: Missing frequency for the OlinkID, i.e. frequency of samples with NPX value below limit of detection (LOD). (e.g., 0.1, 0.2, etc.).Panel: Olink Panel that samples ran on. Read more about Olink Panels here: https://olink.com/products/compare.Panel_Version: Version of the panel. A new panel version might include some different or improved assays (e.g., v.1201).PlateID: Name of the plate. (e.g., Example_Data_1_CAM.csv).QC_Warning: Indication whether the sample passed Olink QC. (e.g., Pass, Warning, Fail).LOD: Limit of detection (LOD) is the minimum level of an individual protein that can be measured. LOD is defined as 3 times the standard deviation over background (e.g., 1.2345, 0.1234, etc.).NPX: Normalized Protein eXpression, is Olink®’s unit of protein expression level in a log2 scale. The majority of the functions of this package use NPX values for calculations. (e.g., 100, 200, etc.).
There are 5 additional variables in the sample datasets npx_data1 and npx_data2 that include clinical or other information, namely: Subject Treatment Site Time Project
B. Preprocessing
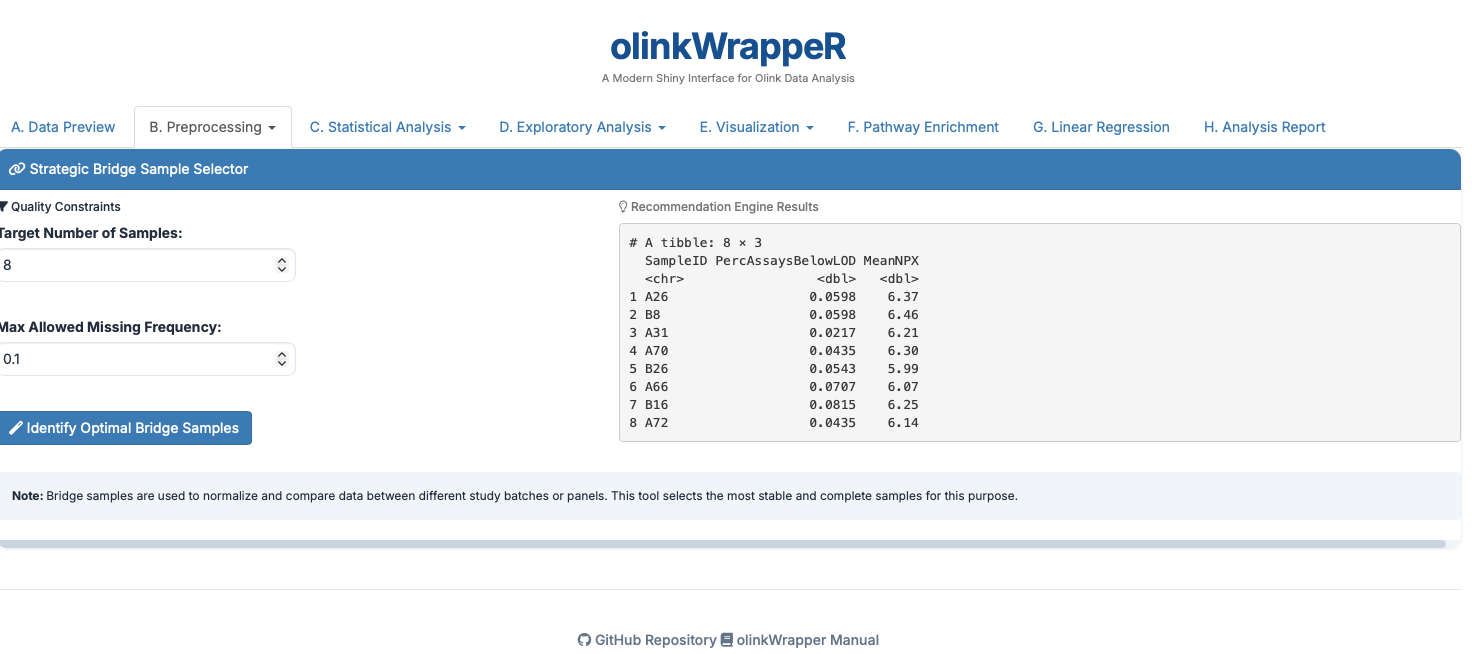
B.1 Bridge Selector
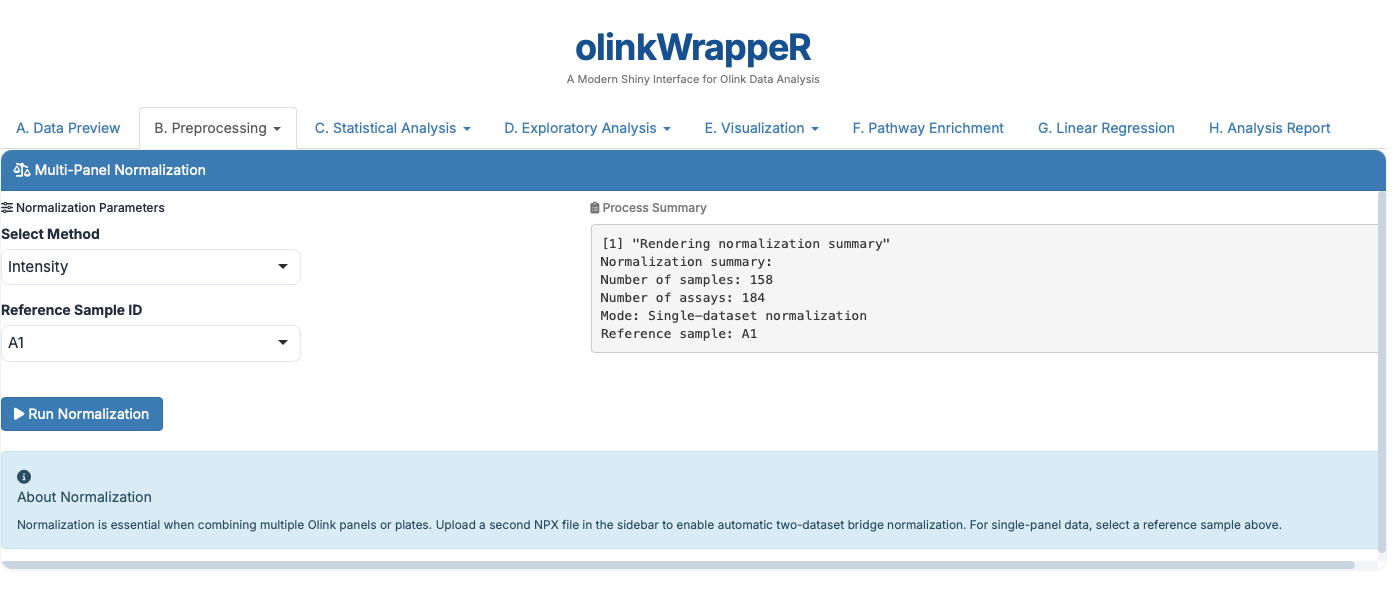
B.2 Normalization
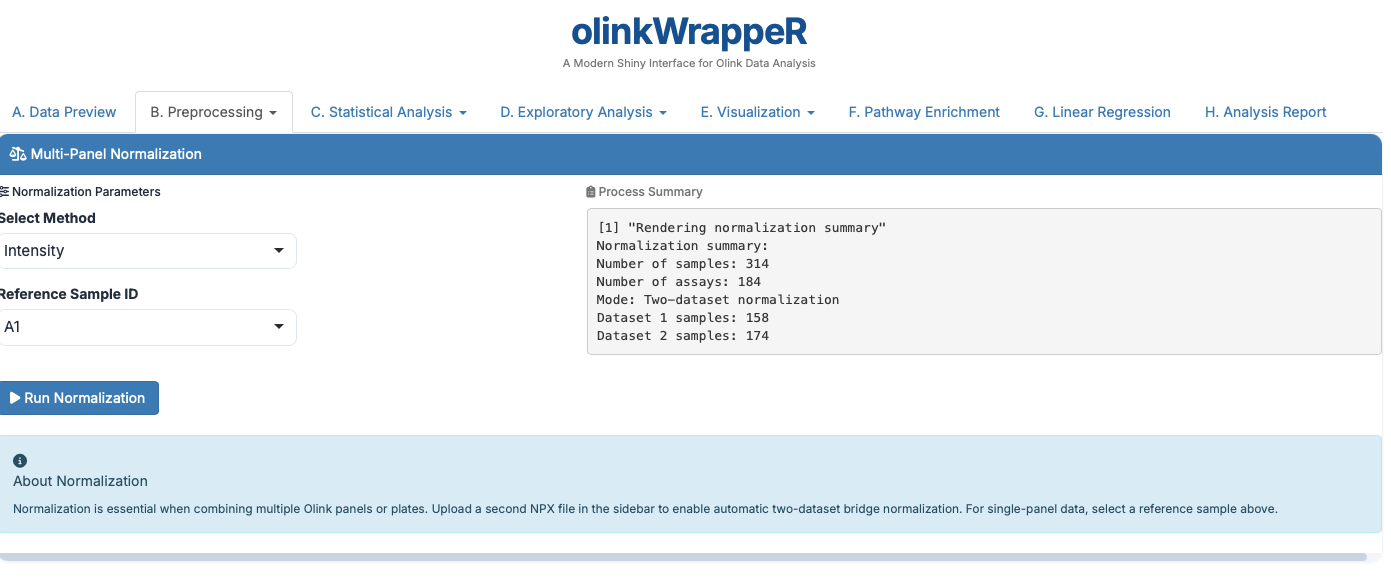
The Olink® normalization function normalizes NPX values between two different datasets or one Olink® dataset to a set of reference medians.
For One dataset,
For Two datasets,
B.3 LOD (Limit of Detection)
This tab allows you to integrate Limit of Detection (LOD) information into your dataset. To find out proteins >50% below LOD values. You can identify and exclude proteins where a high percentage (e.g., >50%) of samples fall below the LOD to improve the robustness of downstream statistical analyses.
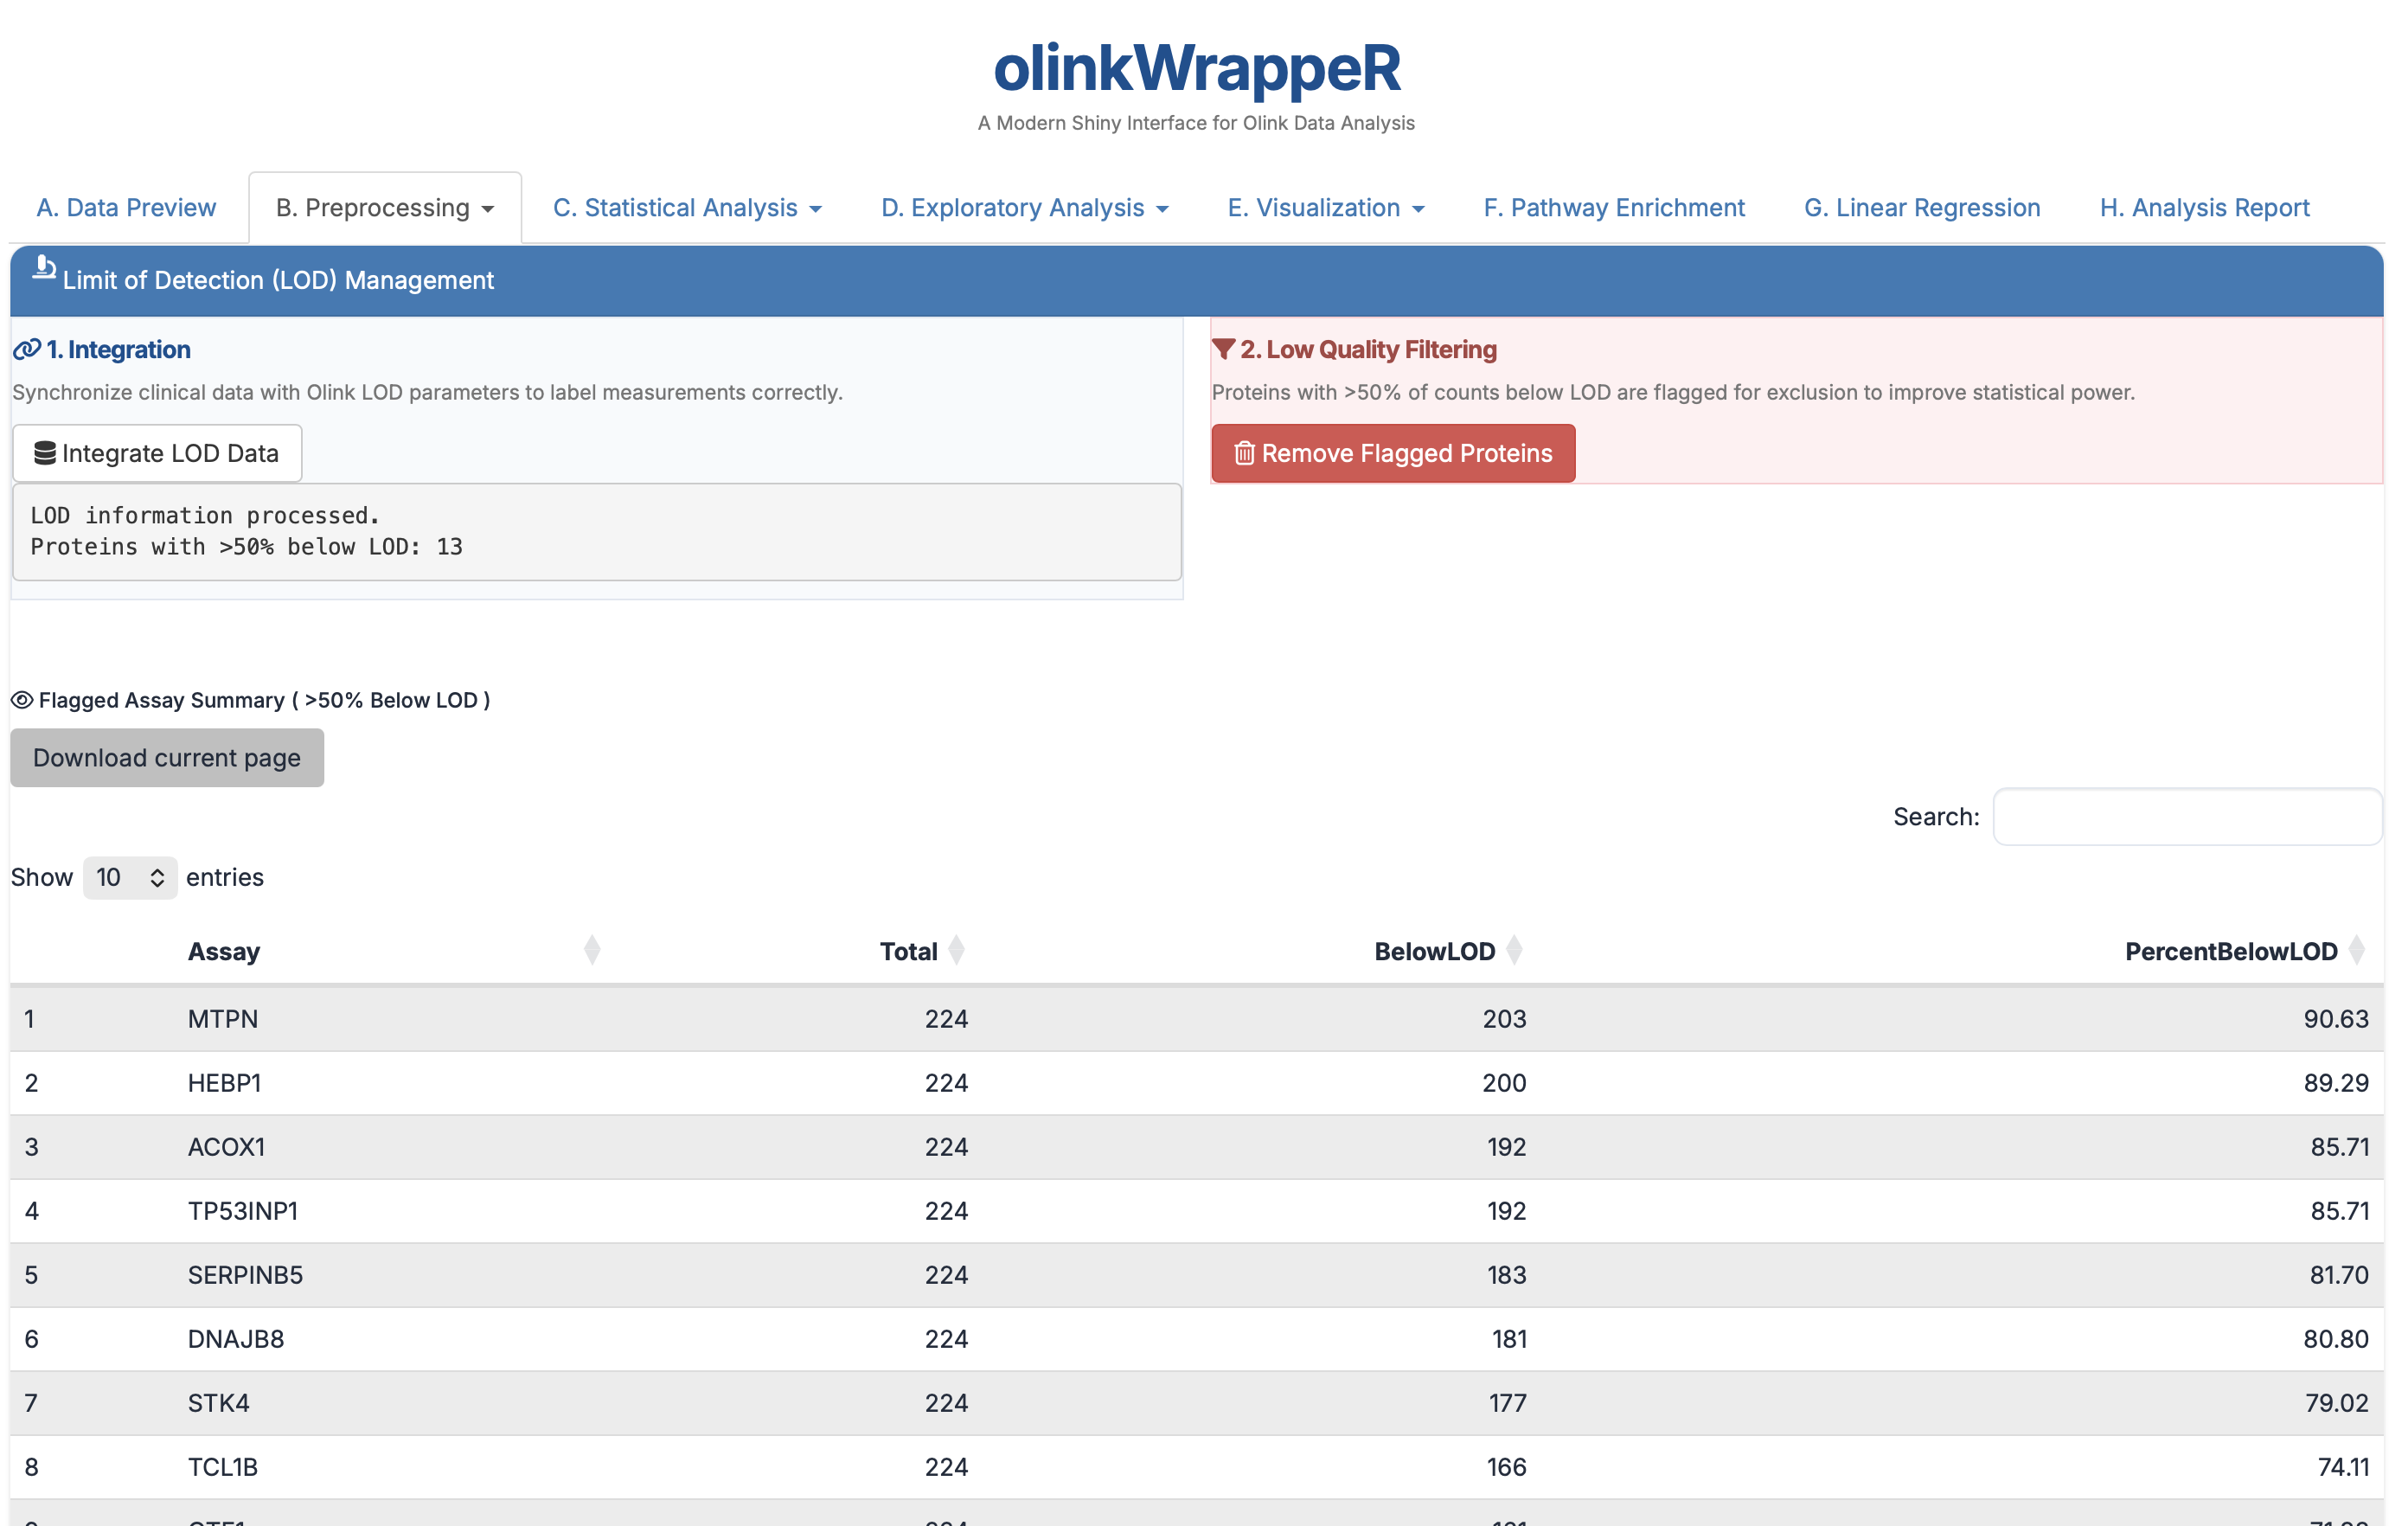
- Interpretation: The horizontal dashed line represents the 50% threshold.
- Requirement: It is standard practice to exclude assays where >50% of samples are below the LOD to maintain high statistical power.
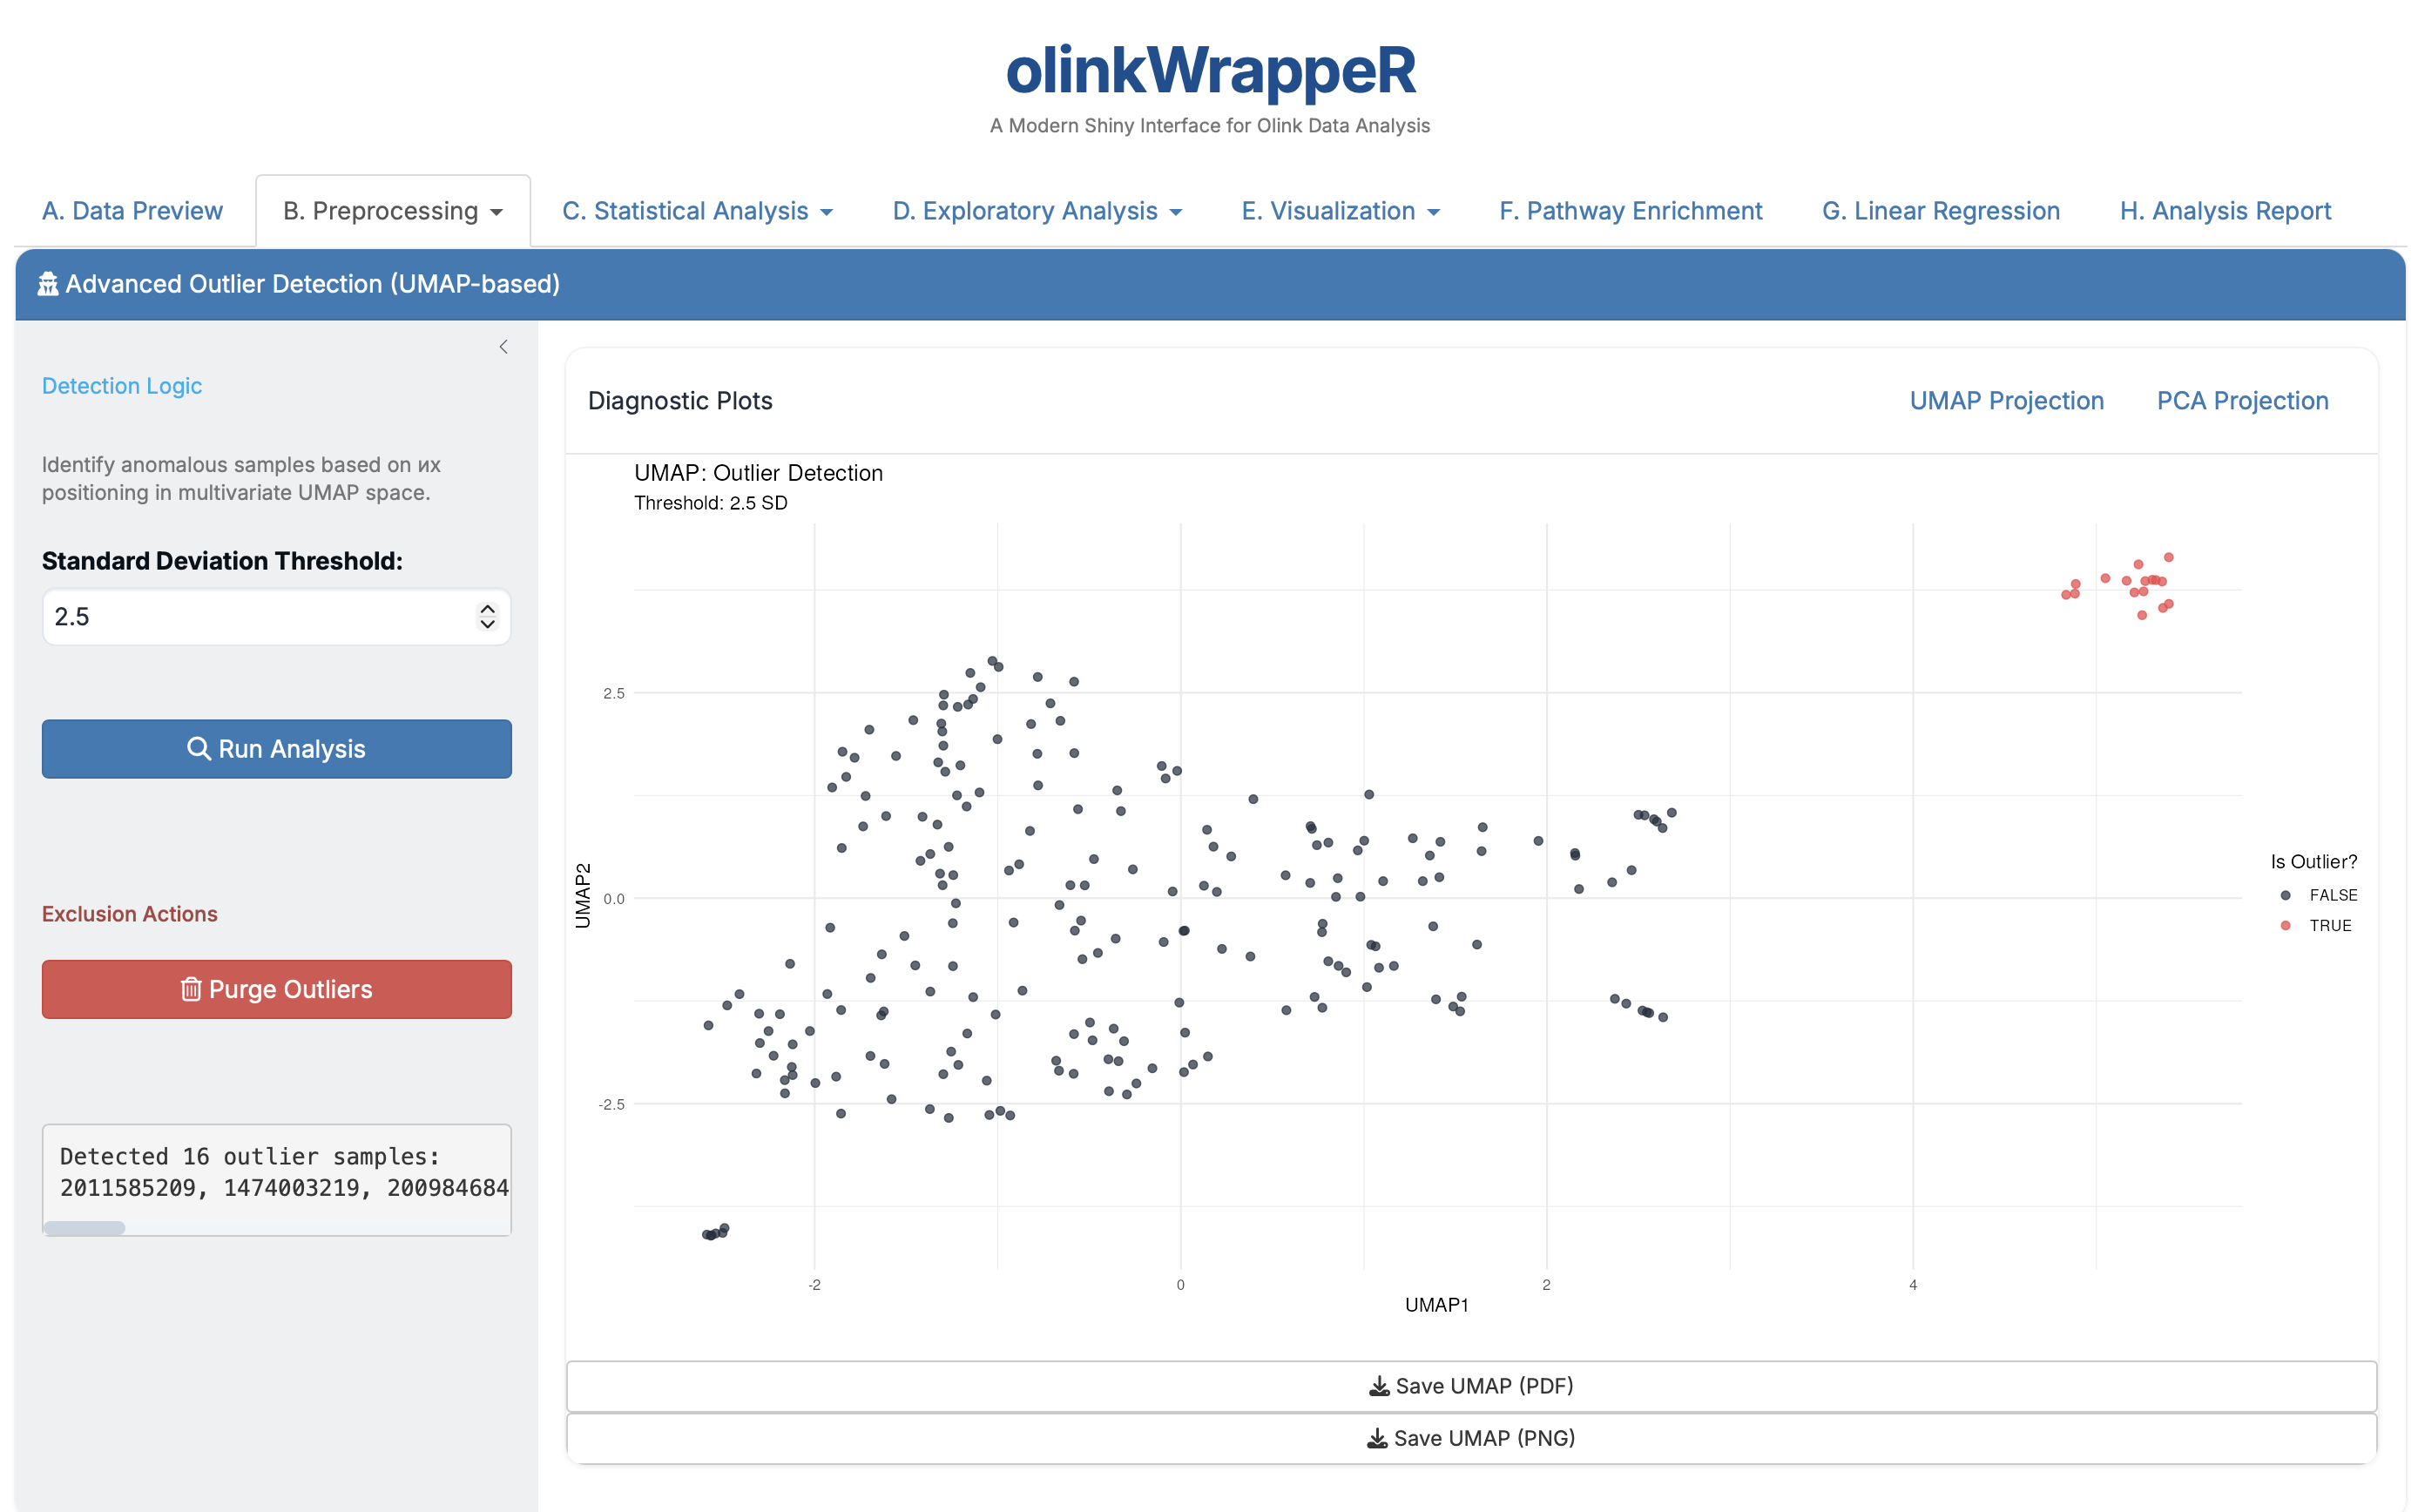
B.4 Outlier Detection
Automated identification of samples that deviate significantly from the rest of the cohort.
-
B.5 Manual Exclusion
Provides the ability to remove specific samples or entire proteins based on researcher knowledge.
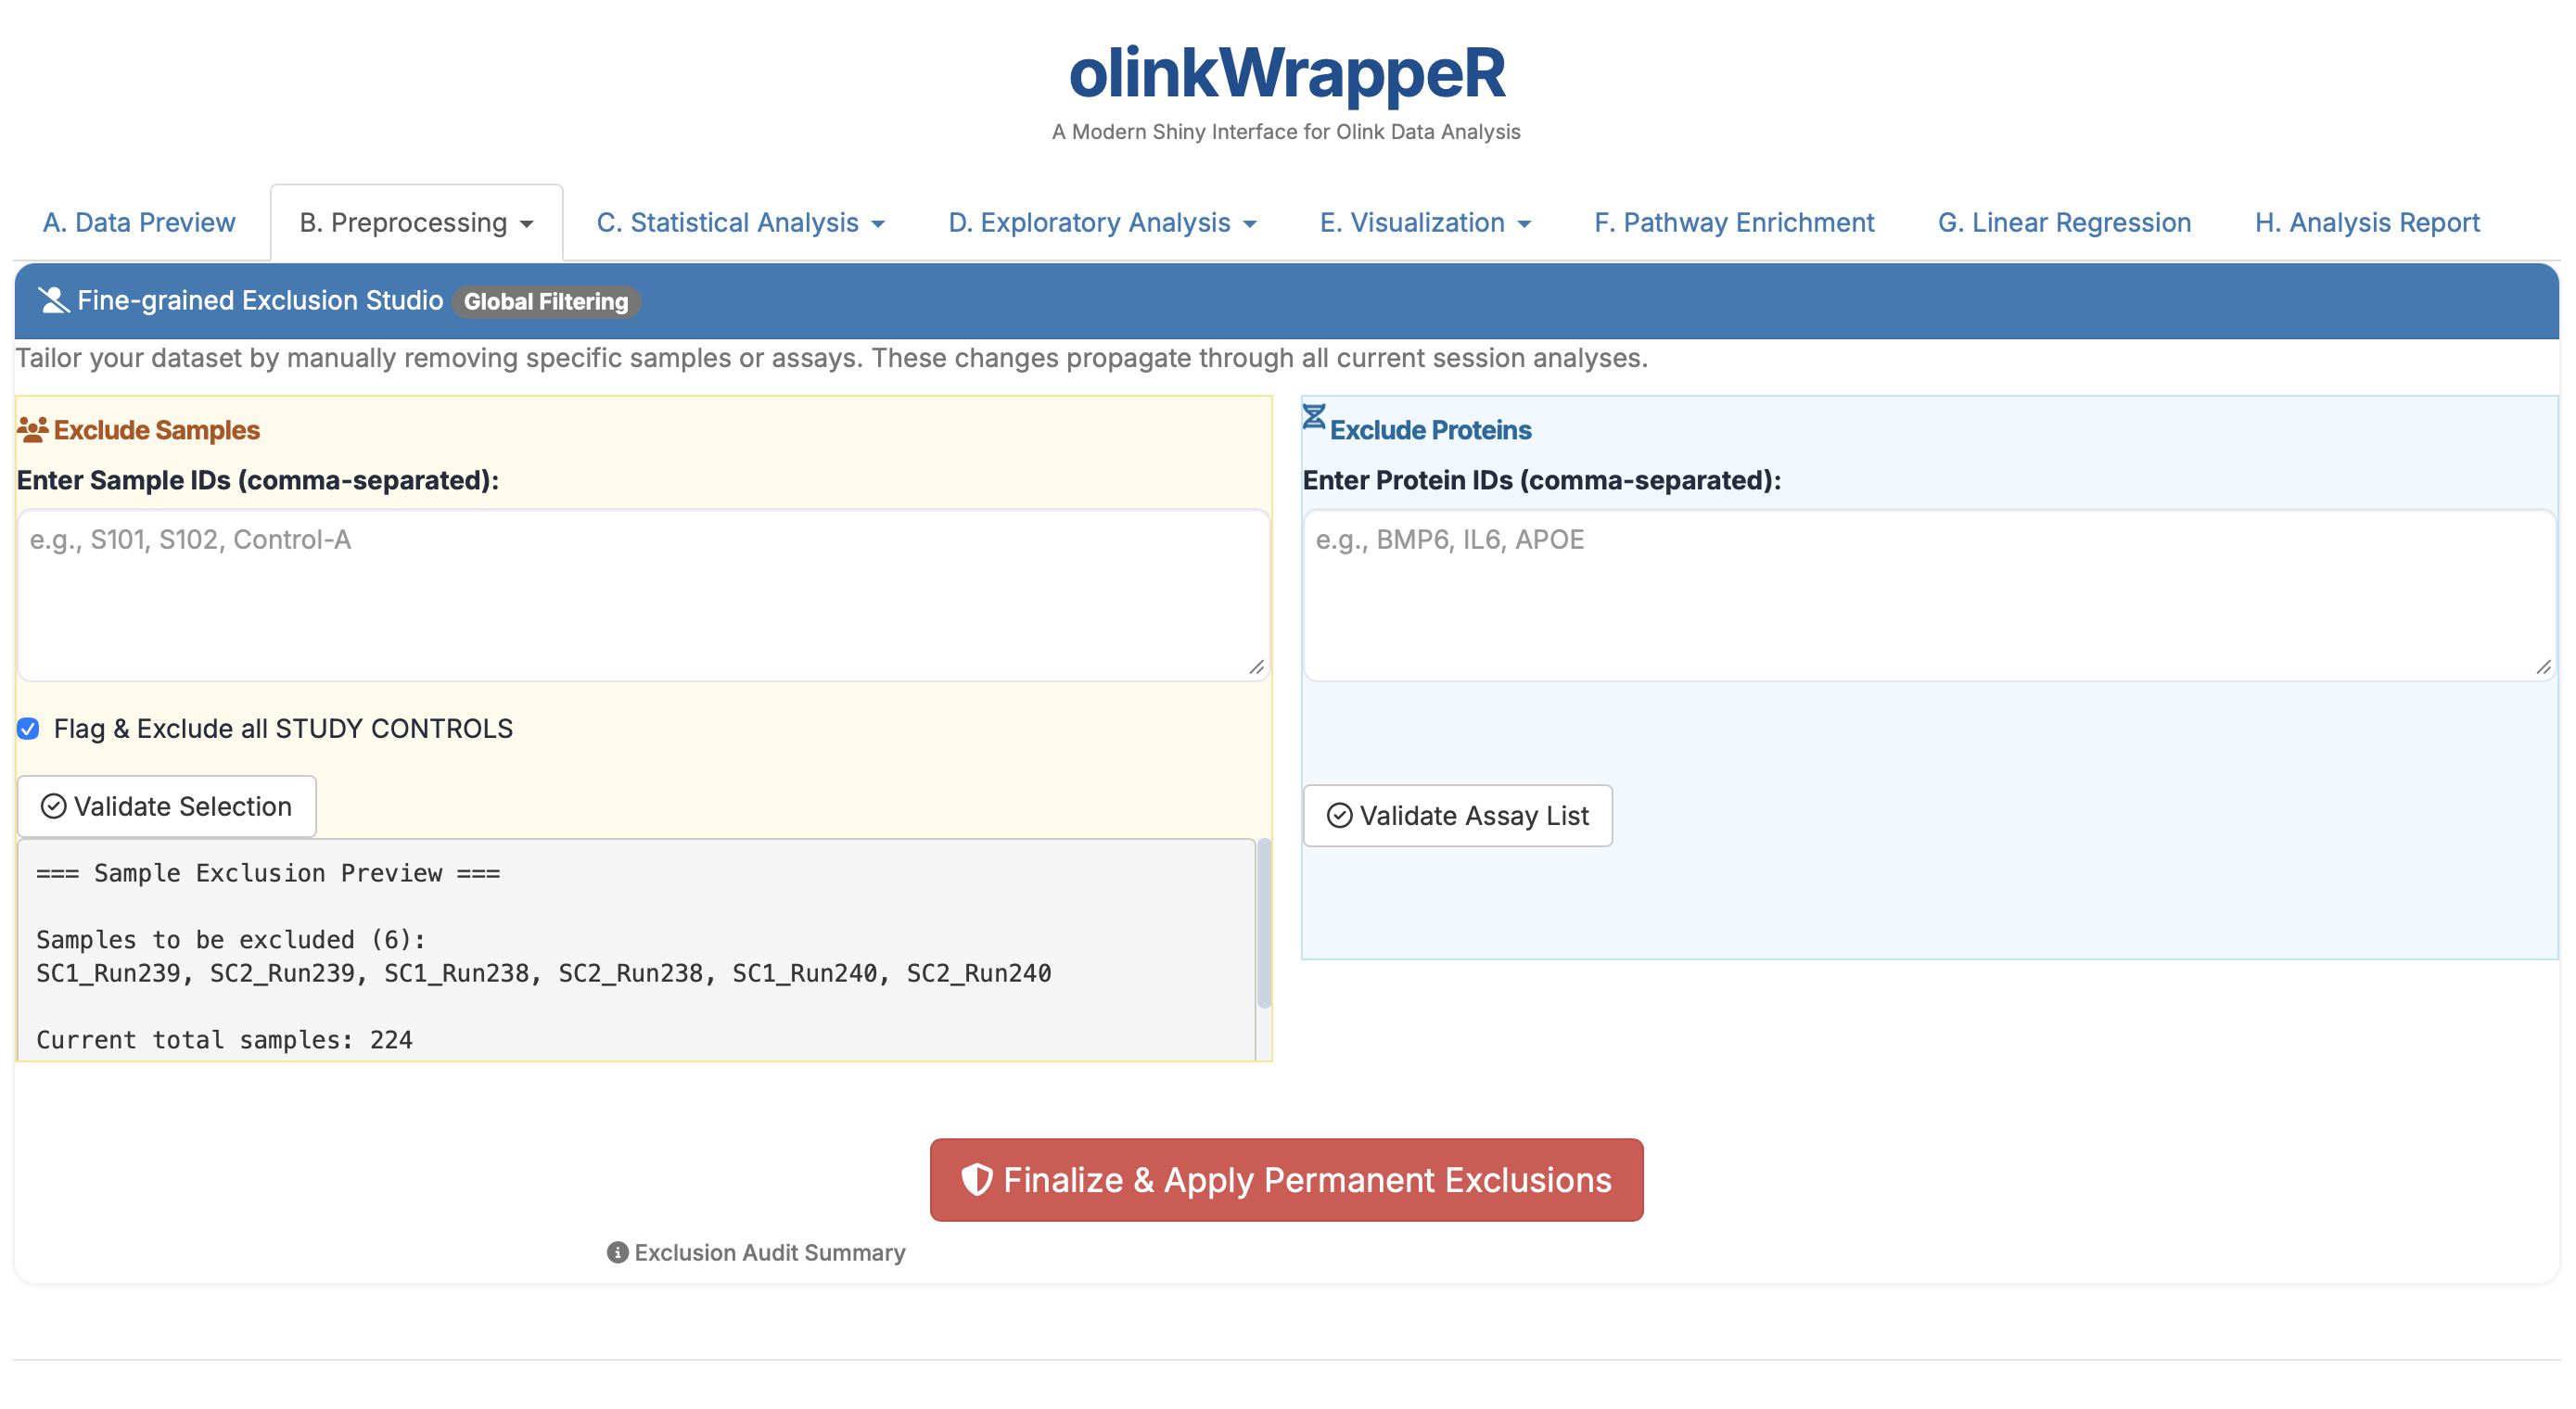
- Requirement: Use this for "bad" samples identified during lab processing that weren't caught by the automated QC.
B.6 Report Download (Preprocessing)
Generates a summary of all cleaning steps taken. Download this to document how your raw data was cleaned before moving to heavy statistics.
C. Statistical Analysis
C.1 Descriptive Statistics
A tabular summary of protein expression across your study groups.
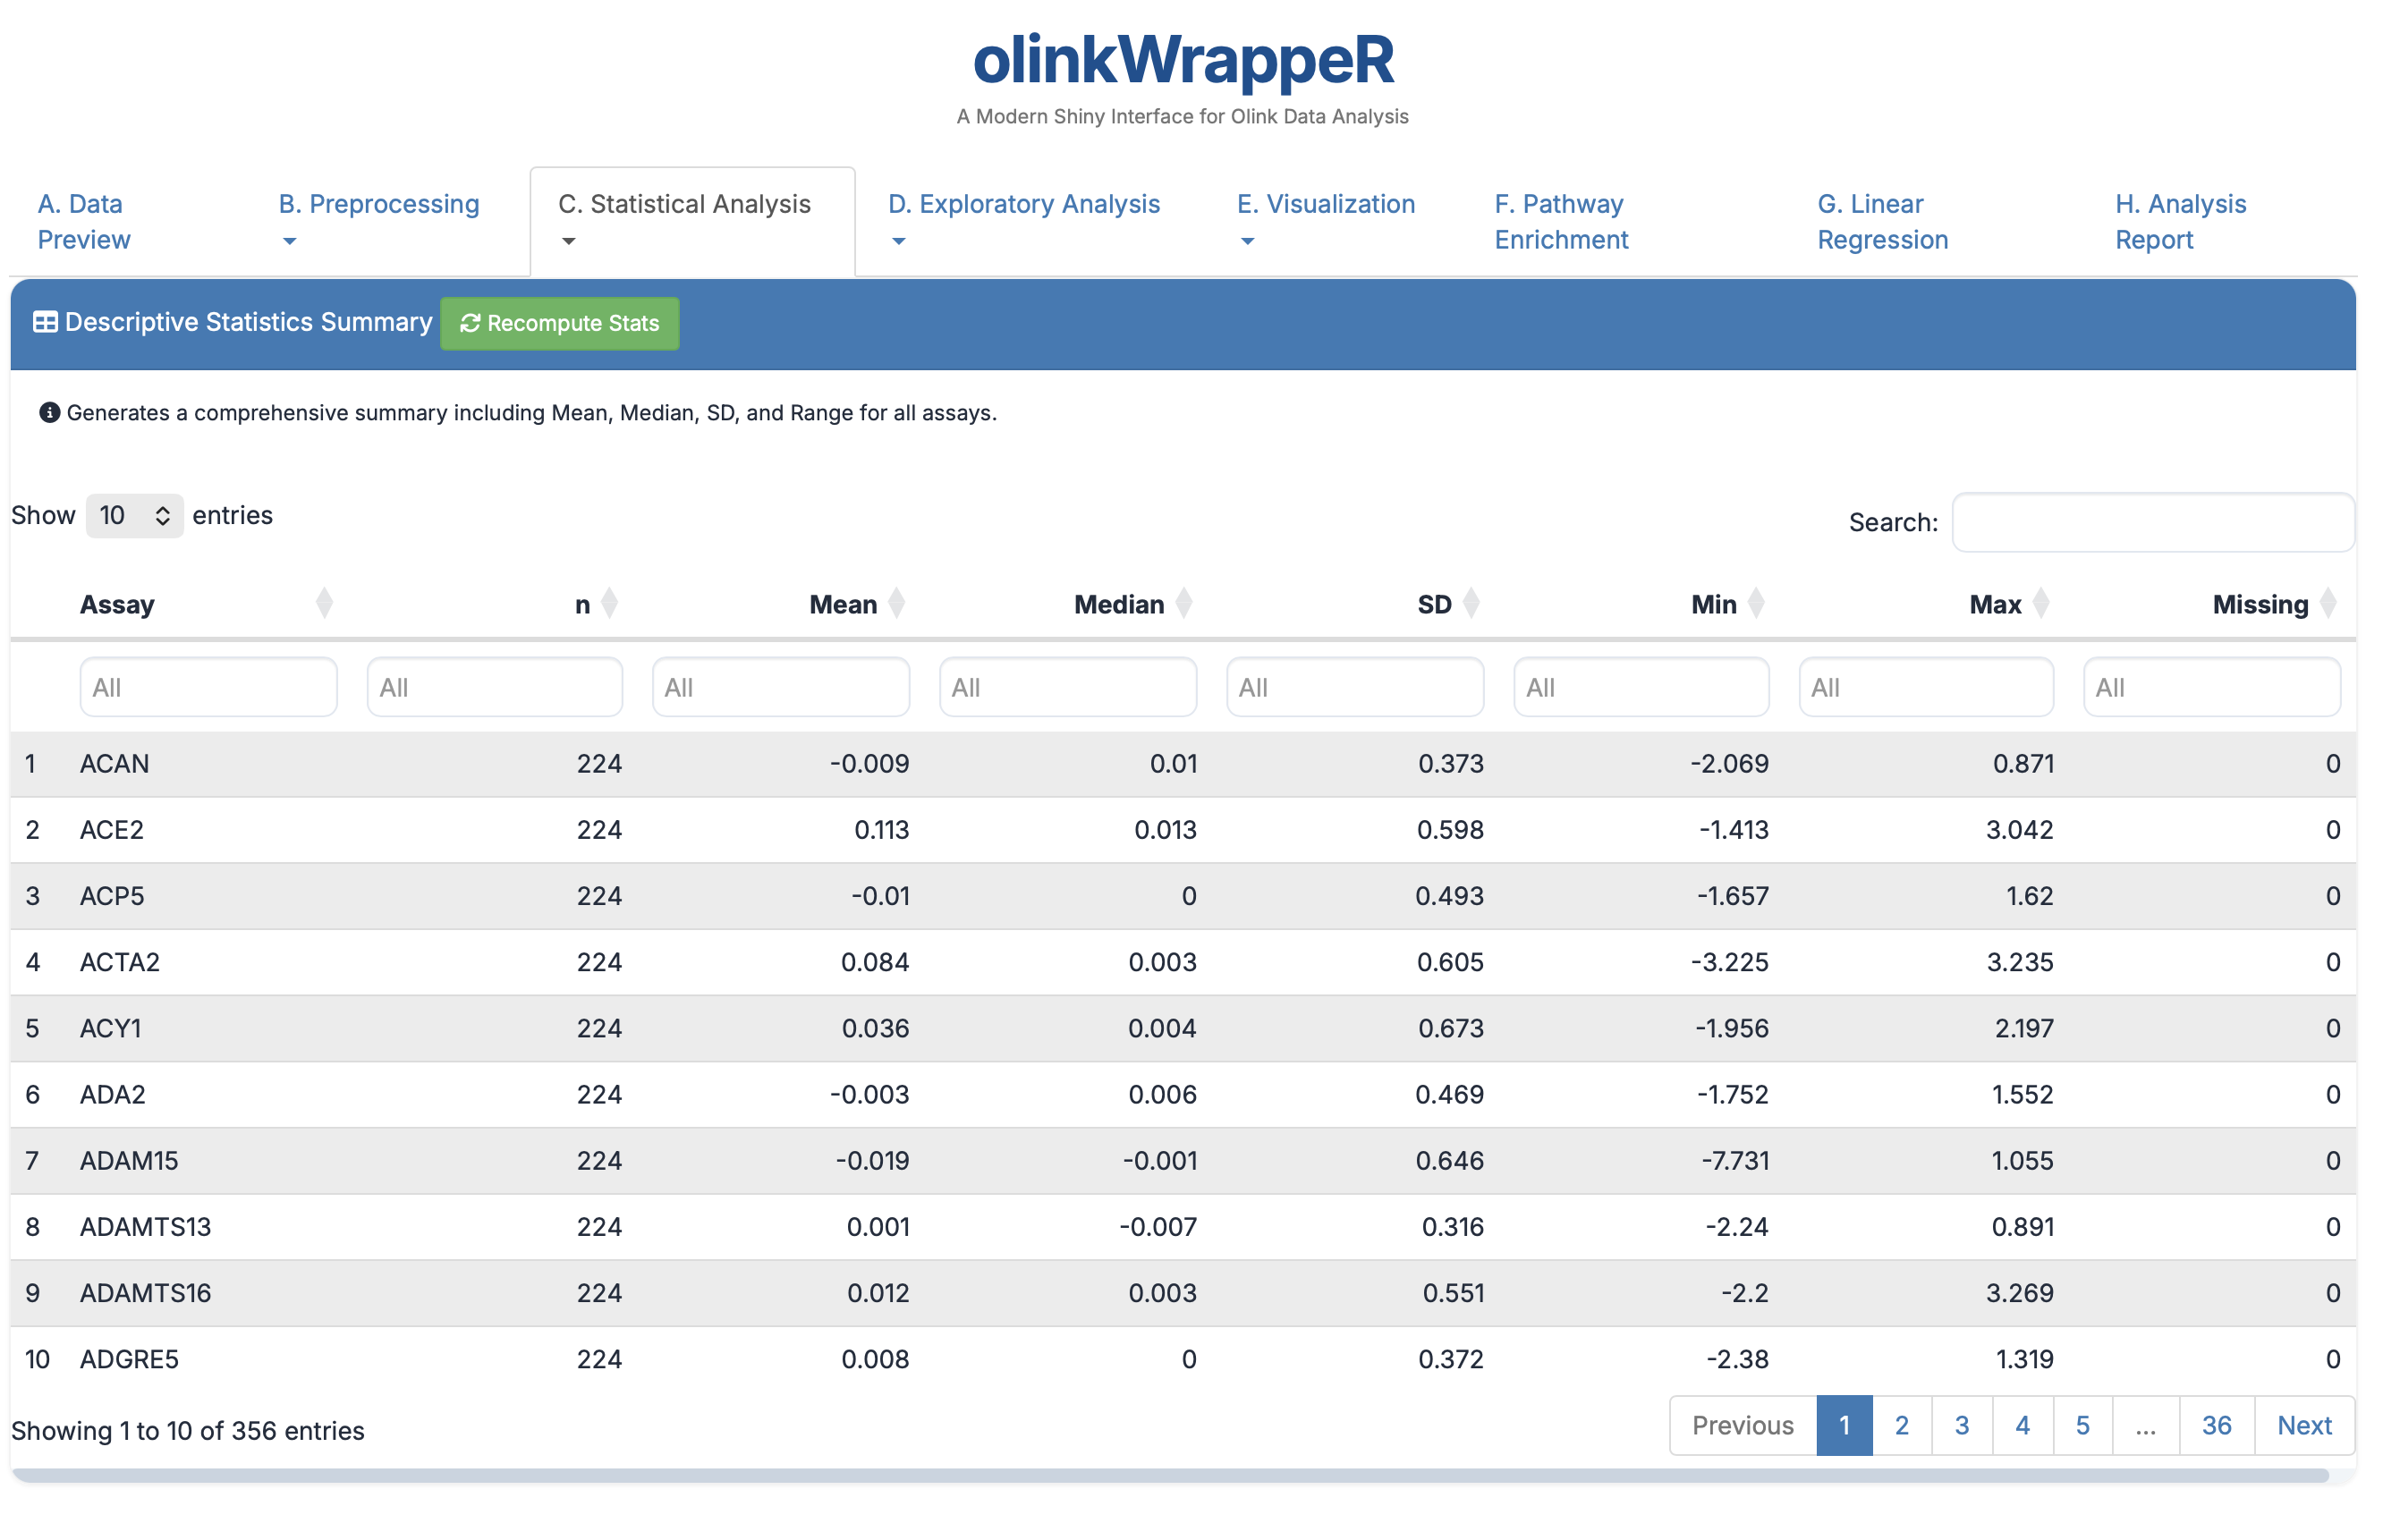
- Columns: Shows Mean, Median, SD, and Range for every protein.
- Relevance: Useful for a high-level check on the spread of your data.
C.2 Normality Test
Statistical evaluation of whether protein expression follows a normal distribution.
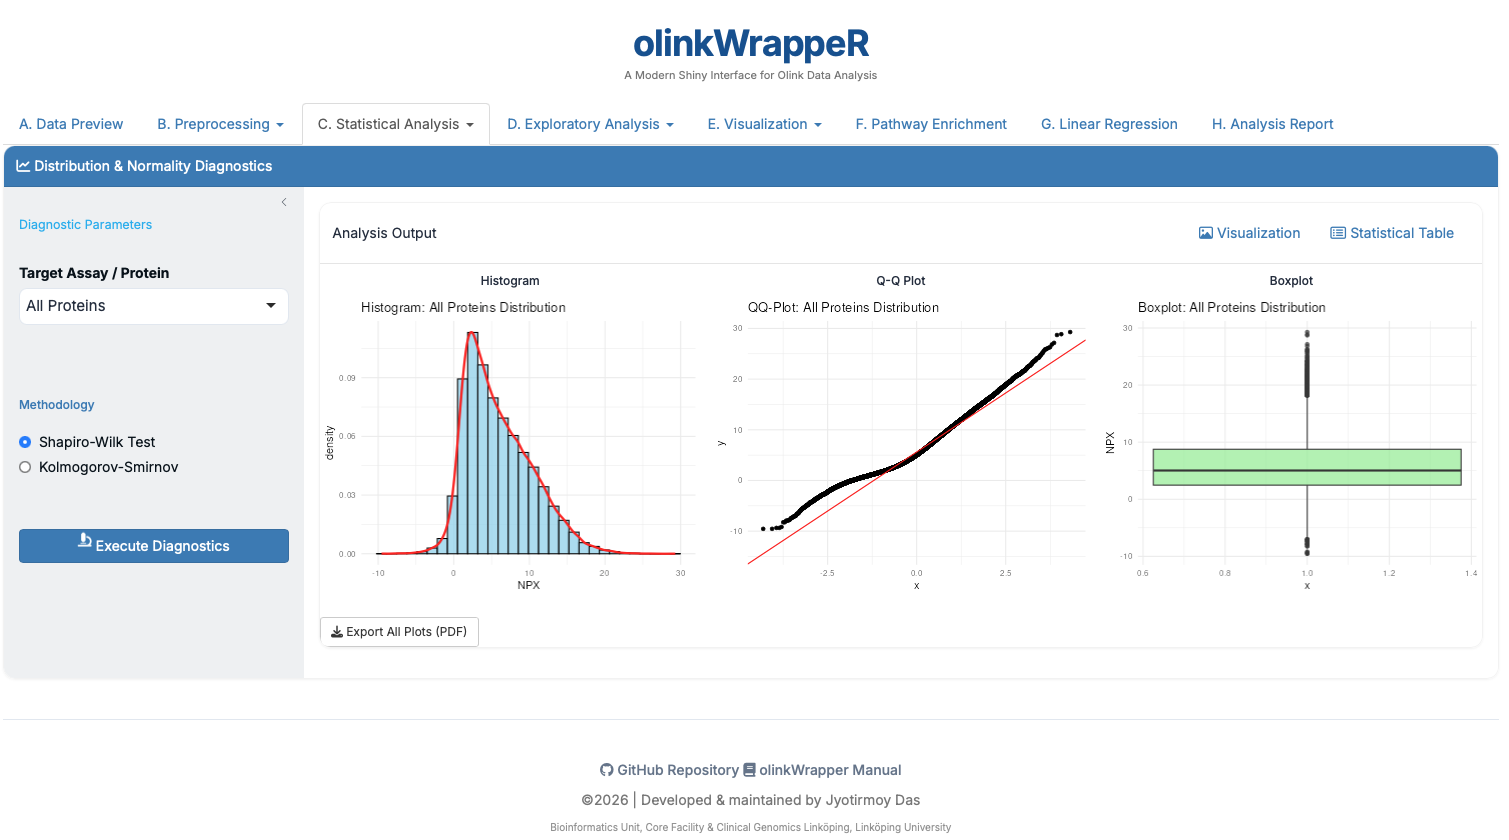
- Interpretation: Shapiro-Wilk p-values < 0.05 indicate non-normal data.
- Requirement: If data is non-normal, use non-parametric tests like Wilcoxon instead of T-tests.
C.3 T-test
A T-test is used to determine if there is a significant difference between the means of two groups.
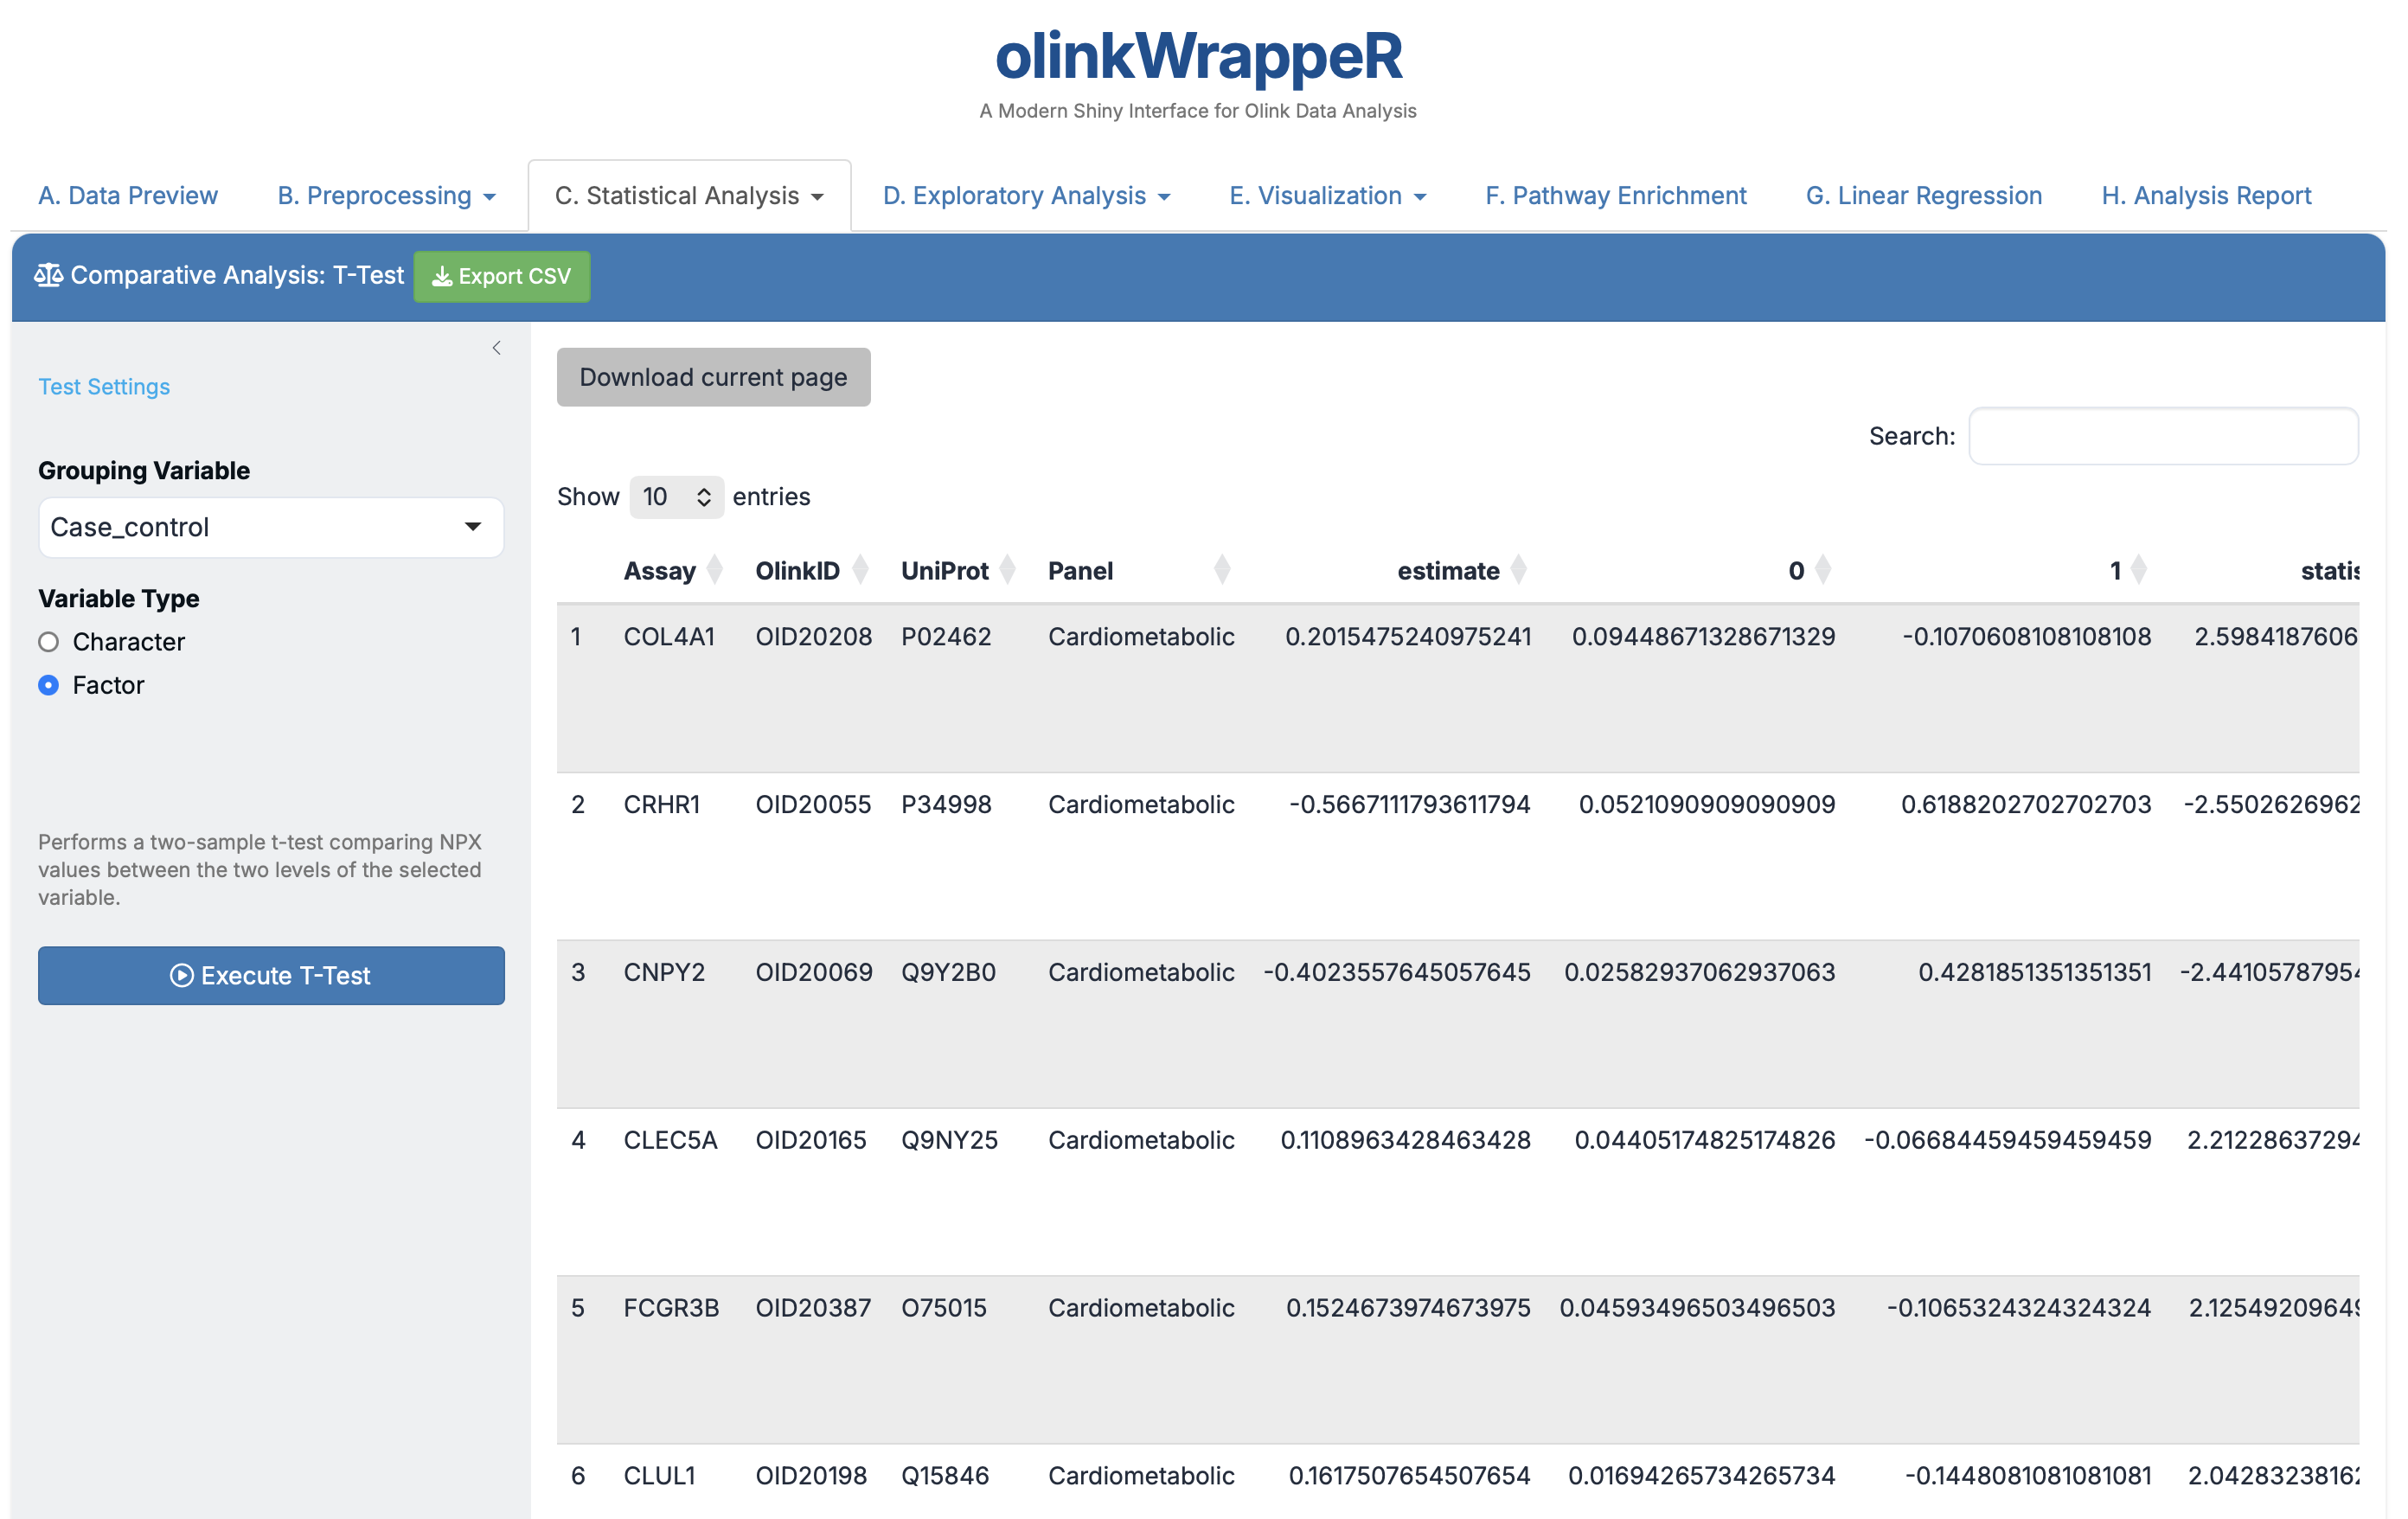
- Interpretation: Focus on the
estimate(log2 Fold Change) and theAdjusted_pval(FDR).
Interpretation of T-test
A tibble with the following columns:
- Assay
: Assay name. - OlinkID
: Unique Olink® ID. - UniProt
: UniProt ID. - Panel
: Olink® Panel. - estimate
: Difference in mean NPX between groups. - statistic
: Value of the t-statistic. - p.value
: P-value for the test. - parameter
: Degrees of freedom for the t-statistic. - conf.low
: Low bound of the confidence interval for the mean. - conf.high
: High bound of the confidence interval for the mean. - method
: Method that was used. - alternative
: Description of the alternative hypothesis. - Adjusted_pval
: Adjusted p-value for the test (Benjamini & Hochberg). - Threshold
: Text indication if assay is significant (adjusted p-value < 0.05).
C.4 Wilcoxon Test
A non-parametric test for comparing two groups.
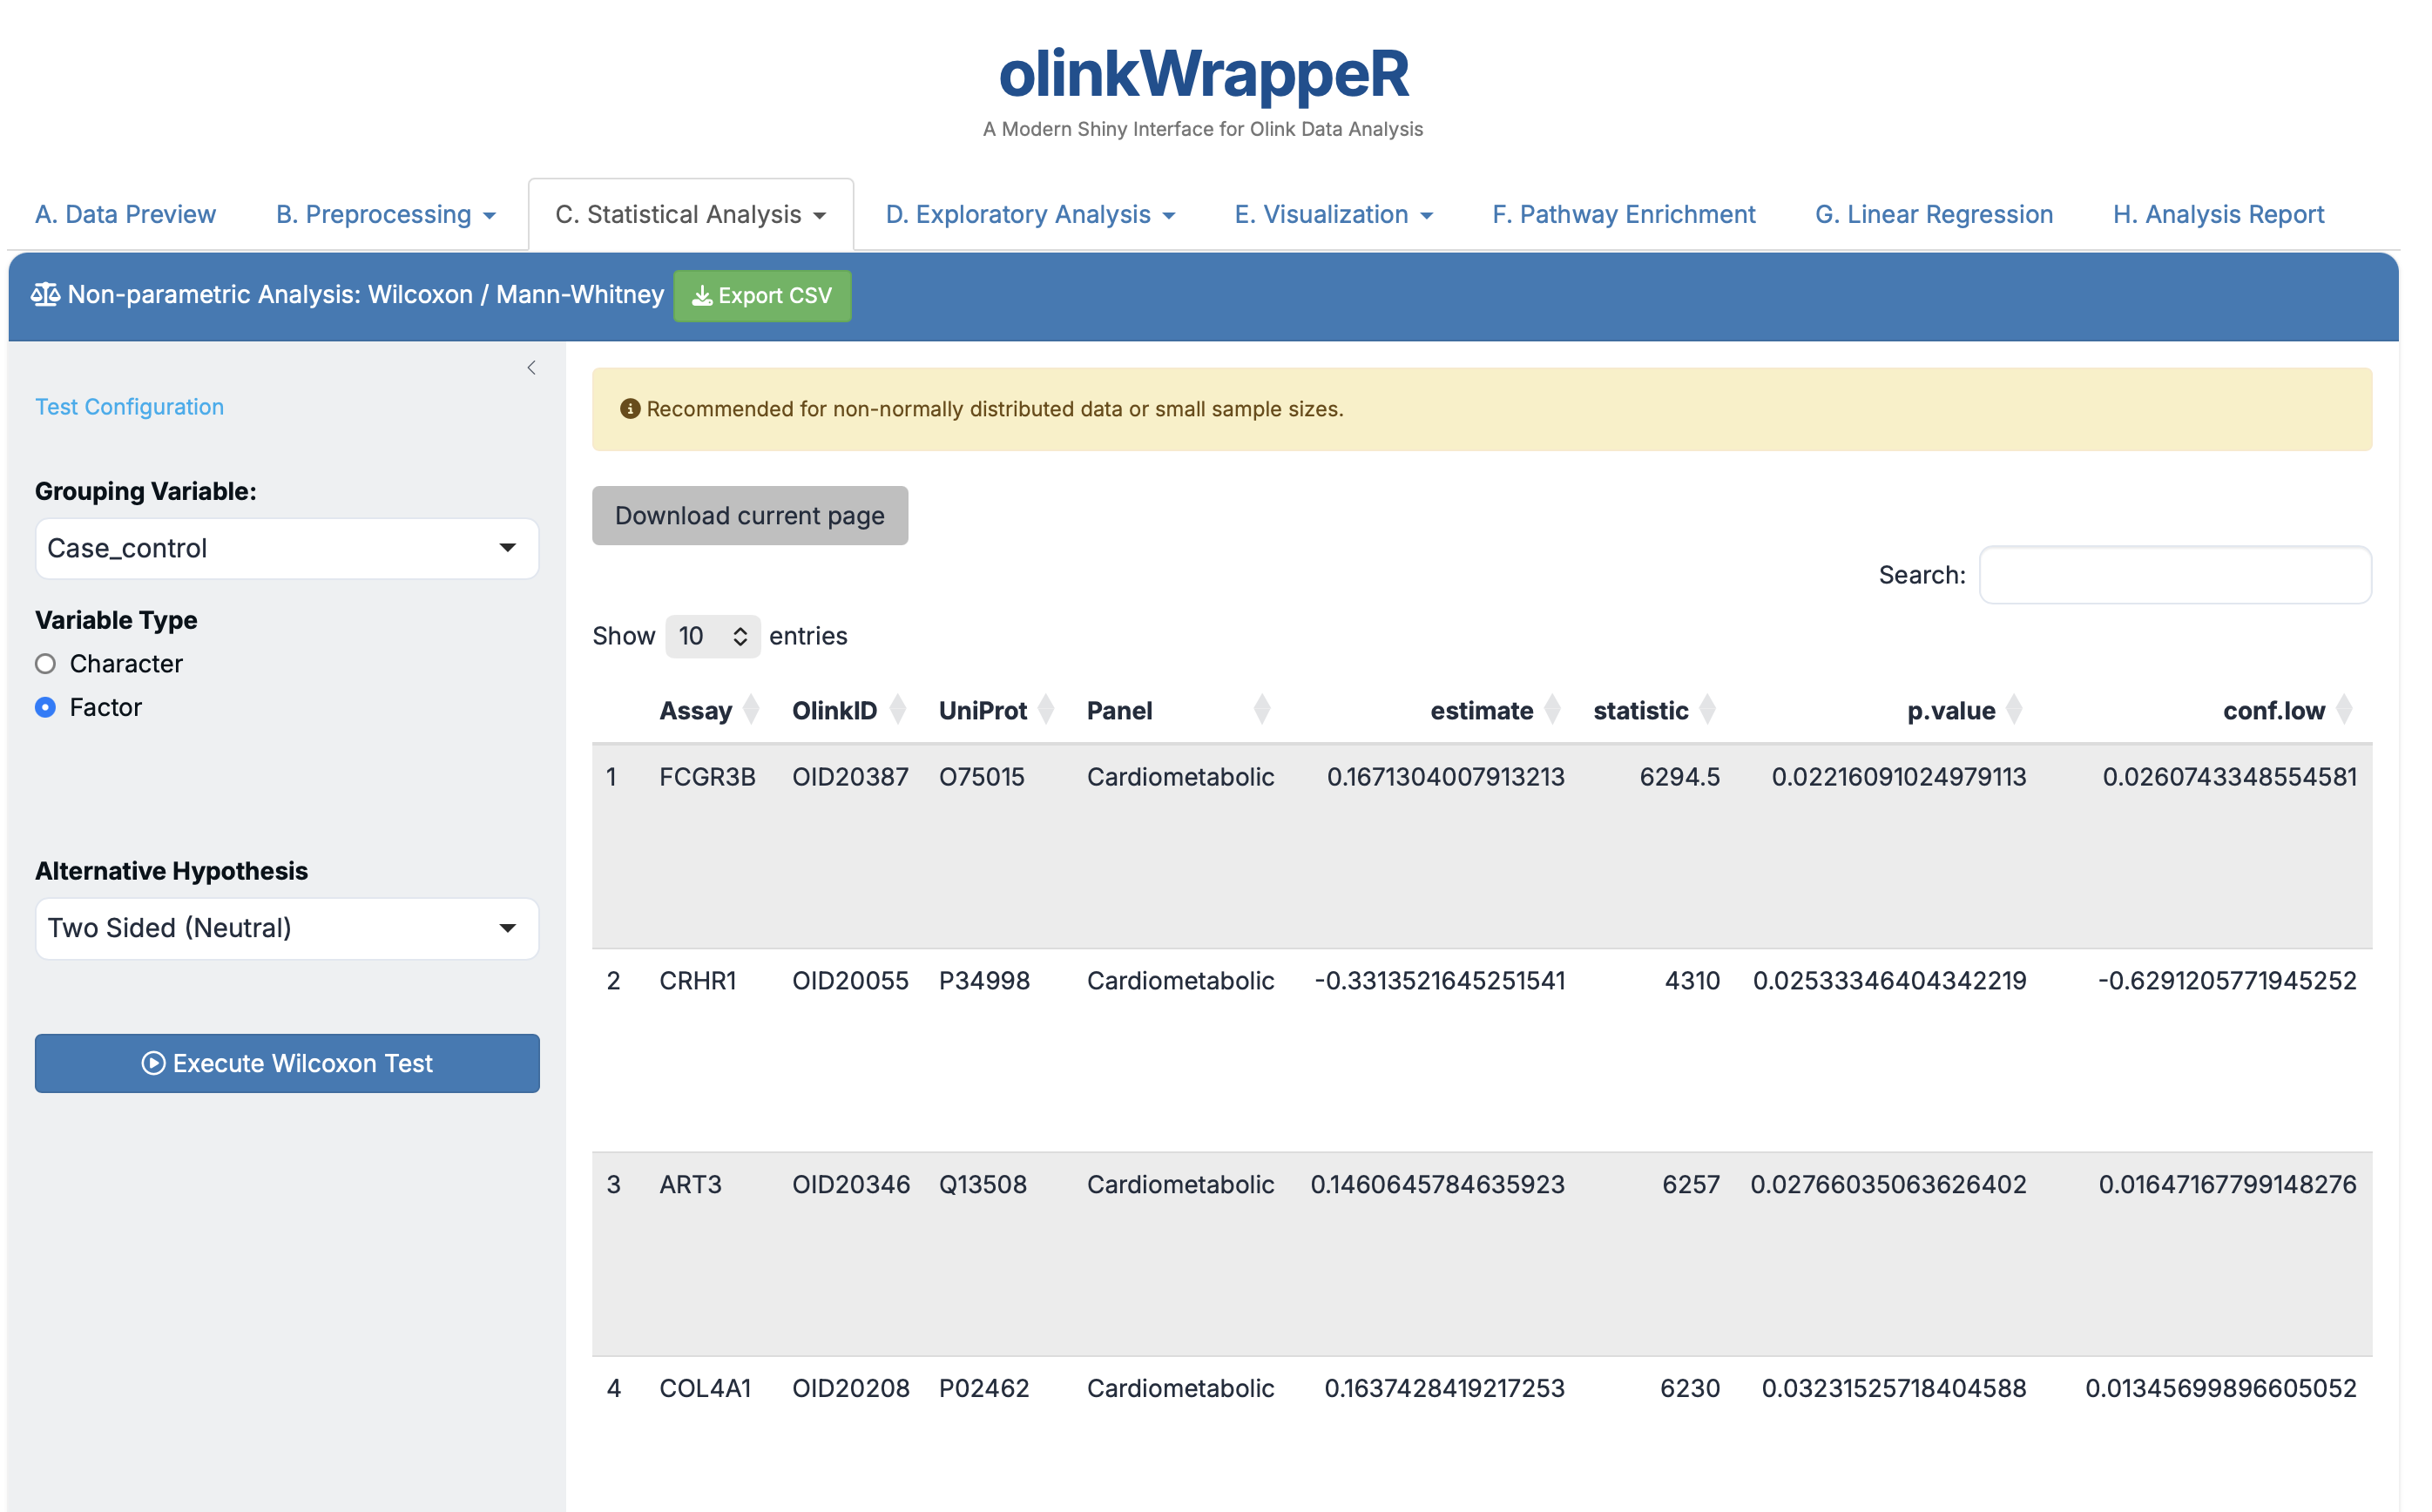
- Usage: Prefer this results table if your proteins failed the Normality test in step C.2.
Interpretation of Wilcoxon Test
A tibble with the following columns:
- Assay
: Assay name. - OlinkID
: Unique Olink® ID. - UniProt
: UniProt ID. - Panel
: Olink® Panel. - statistic
: Value of the Mann-Whitney U statistic. - p.value
: P-value for the test. - method
: Method that was used. - alternative
: Description of the alternative hypothesis. - Adjusted_pval
: Adjusted p-value for the test (Benjamini & Hochberg). - Threshold
: Text indication if assay is significant (adjusted p-value < 0.05).
C.5 ANOVA
ANOVA is used to compare the means of three or more groups to see if at least one group mean is different from the others.
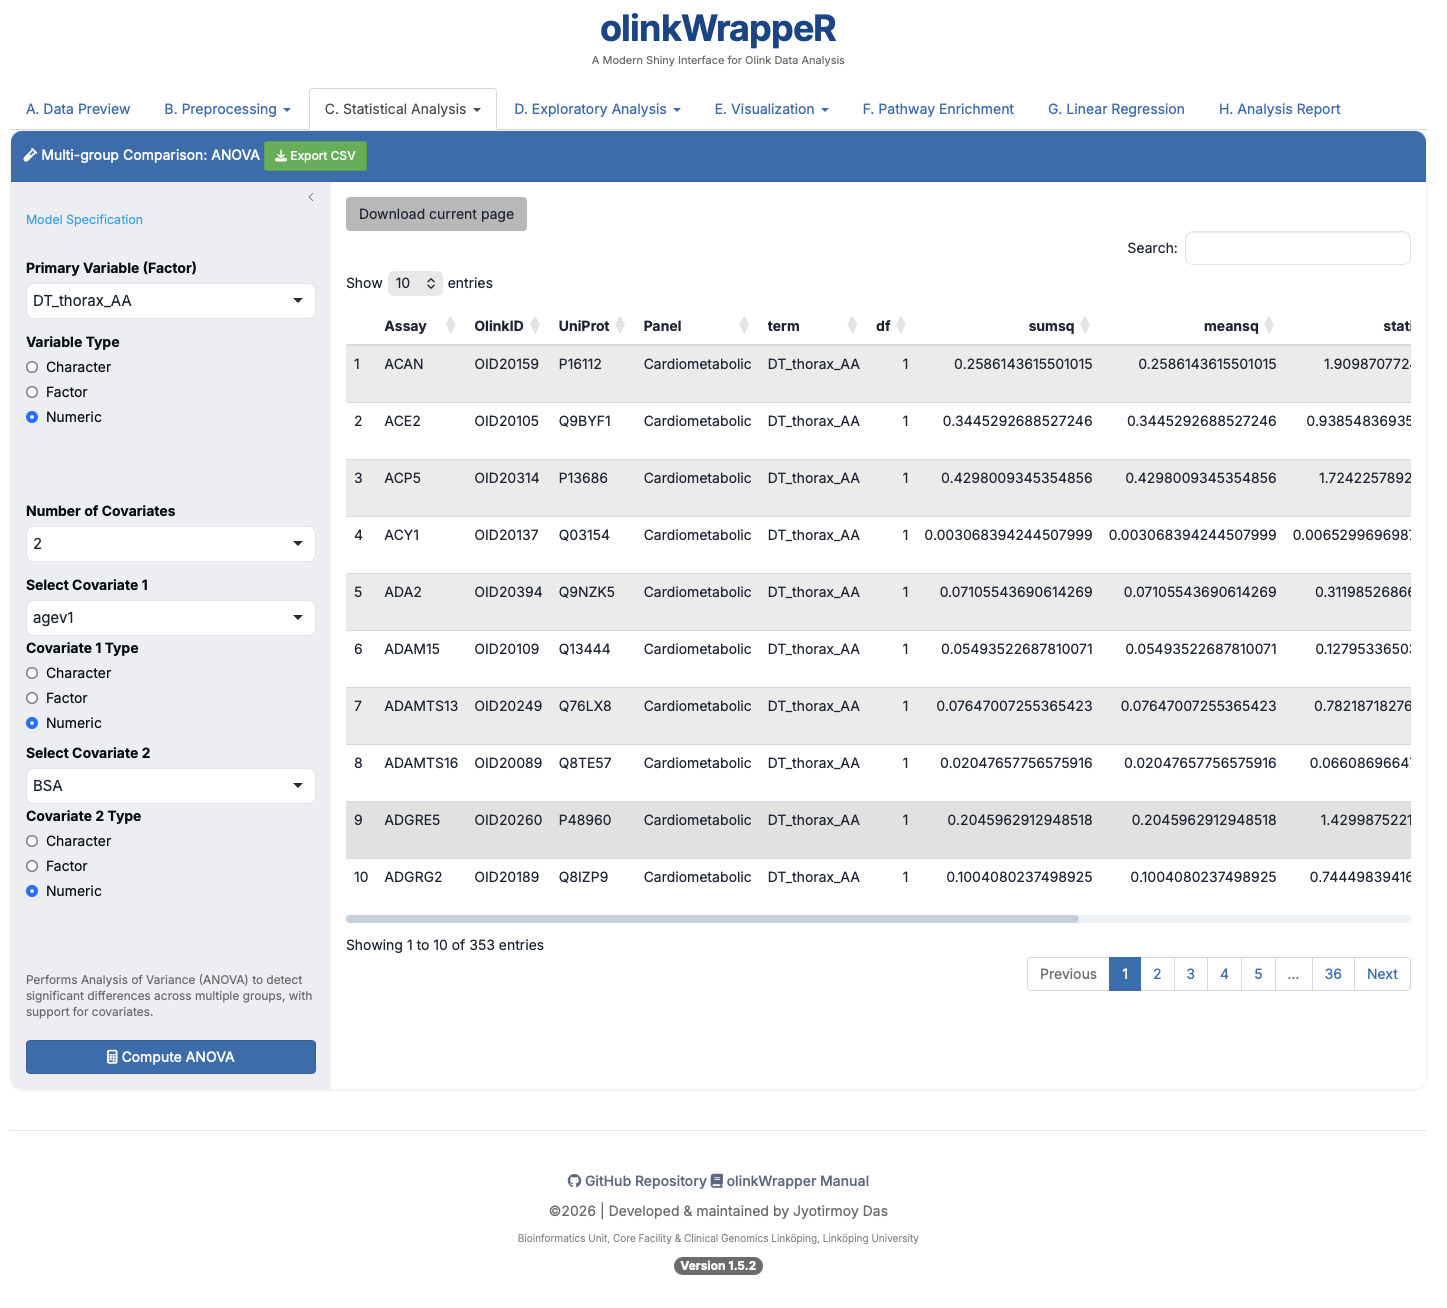
Interpretation of ANOVA
A tibble with the following columns:
- Assay
: Assay name. - OlinkID
: Unique Olink ID. - UniProt
: UniProt ID. - Panel
: Olink Panel. - term
: Name of the variable that was used for the p-value calculation. The “:” between variables indicates interaction between variables. - df
: Numerator of degrees of freedom. - sumsq
: Sum of squares. - meansq
: Mean of squares. - statistic
: Value of F-statistic. - p.value
: P-value for the test. - Adjusted_pval
: Adjusted p-value for the test (Benjamini & Hochberg). - Threshold
: Text indication if assay is significant (adjusted p-value < 0.05).
C.6 ANOVA Post-hoc
If an ANOVA test is significant, a post-hoc test is used to determine which specific groups are different from each other.
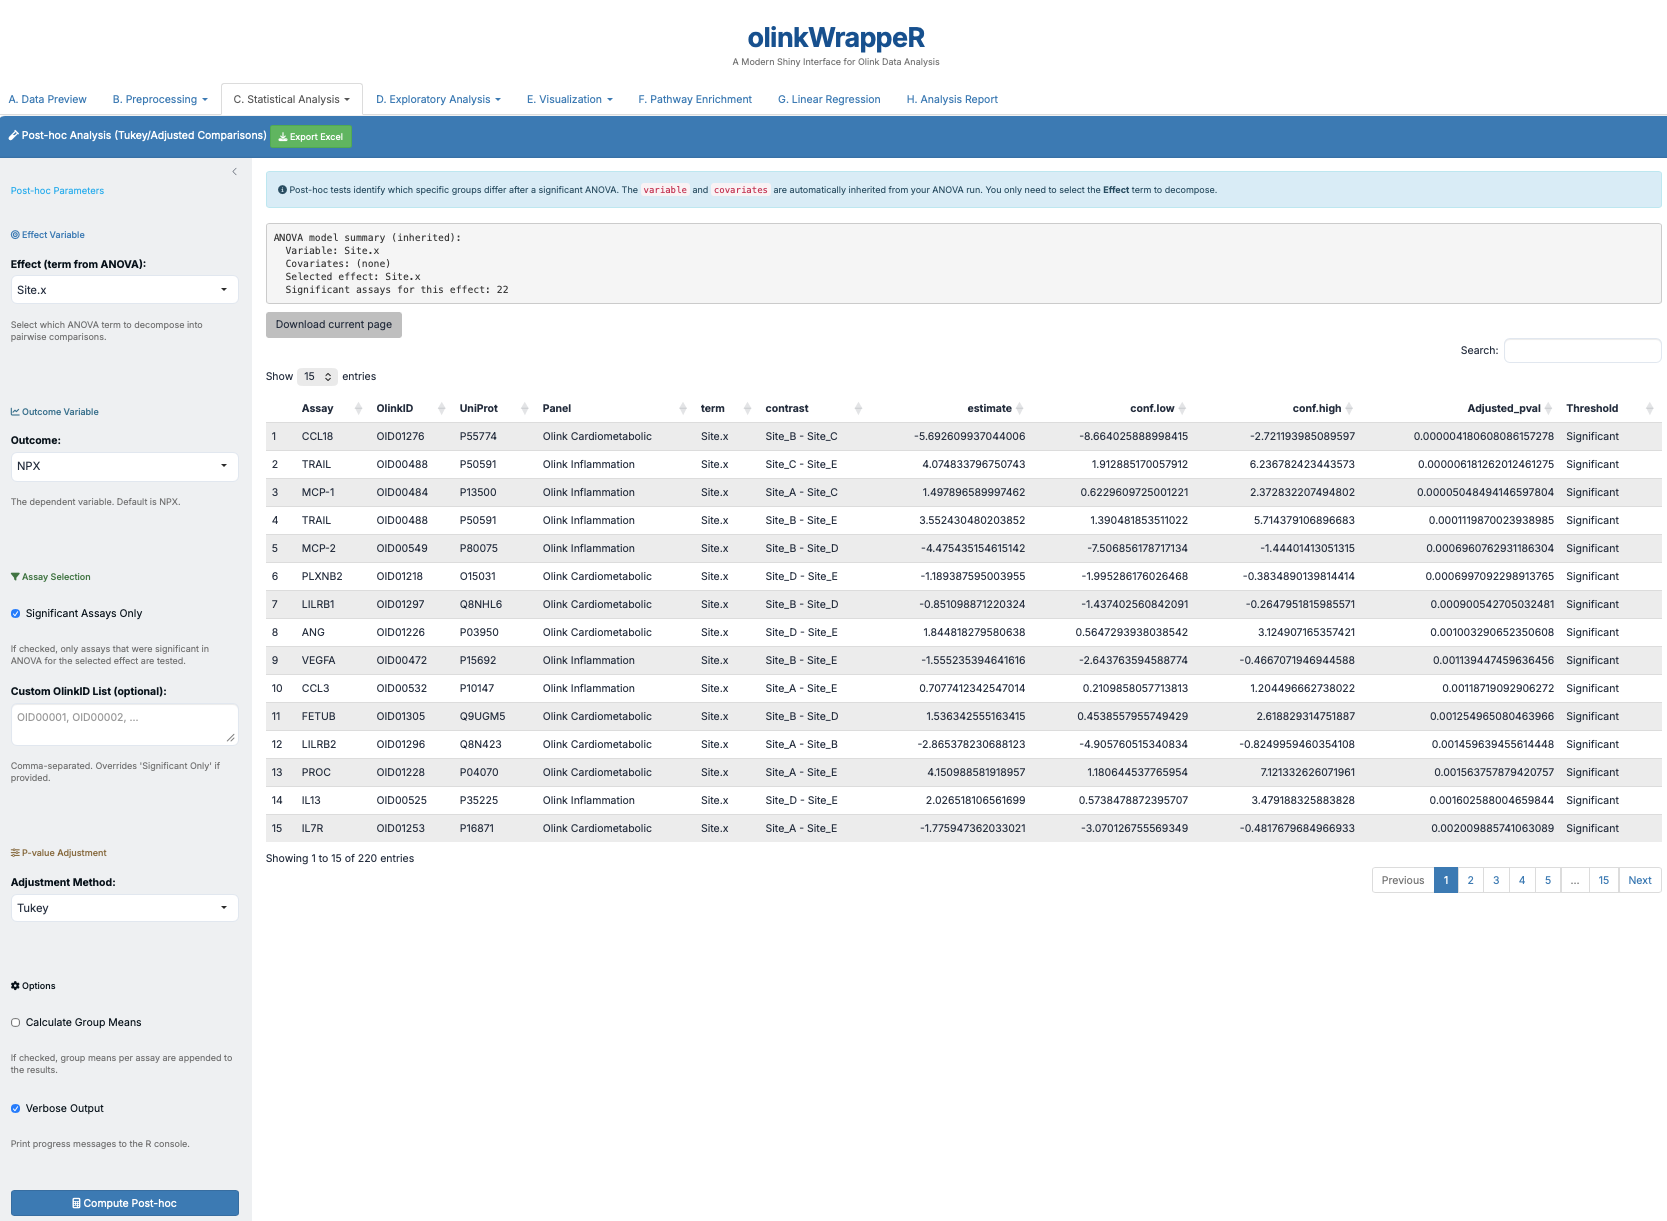
Interpretation of ANOVA Post-hoc
A tibble with the following columns:
- Assay
: Assay name. - OlinkID
: Unique Olink ID. - UniProt
: UniProt ID. - Panel
: Olink Panel. - term
: Name of the variable that was used for the p-value calculation. The “:” between variables indicates interaction between variables. - contrast
: Variables (in term) that are compared. - estimate
: Difference in mean NPX between variables (from contrast). - conf.low
: Low bound of the confidence interval for the mean. - conf.high
: High bound of the confidence interval for the mean. - Adjusted_pval
: Adjusted p-value for the test (Benjamini & Hochberg). - Threshold
: Text indication if assay is significant (adjusted p-value < 0.05).
C.7 Linear Mixed Effects (LME)
LME models are powerful tools used for analyzing data where samples are not independent, such as longitudinal studies where the same subjects are measured at different time points.
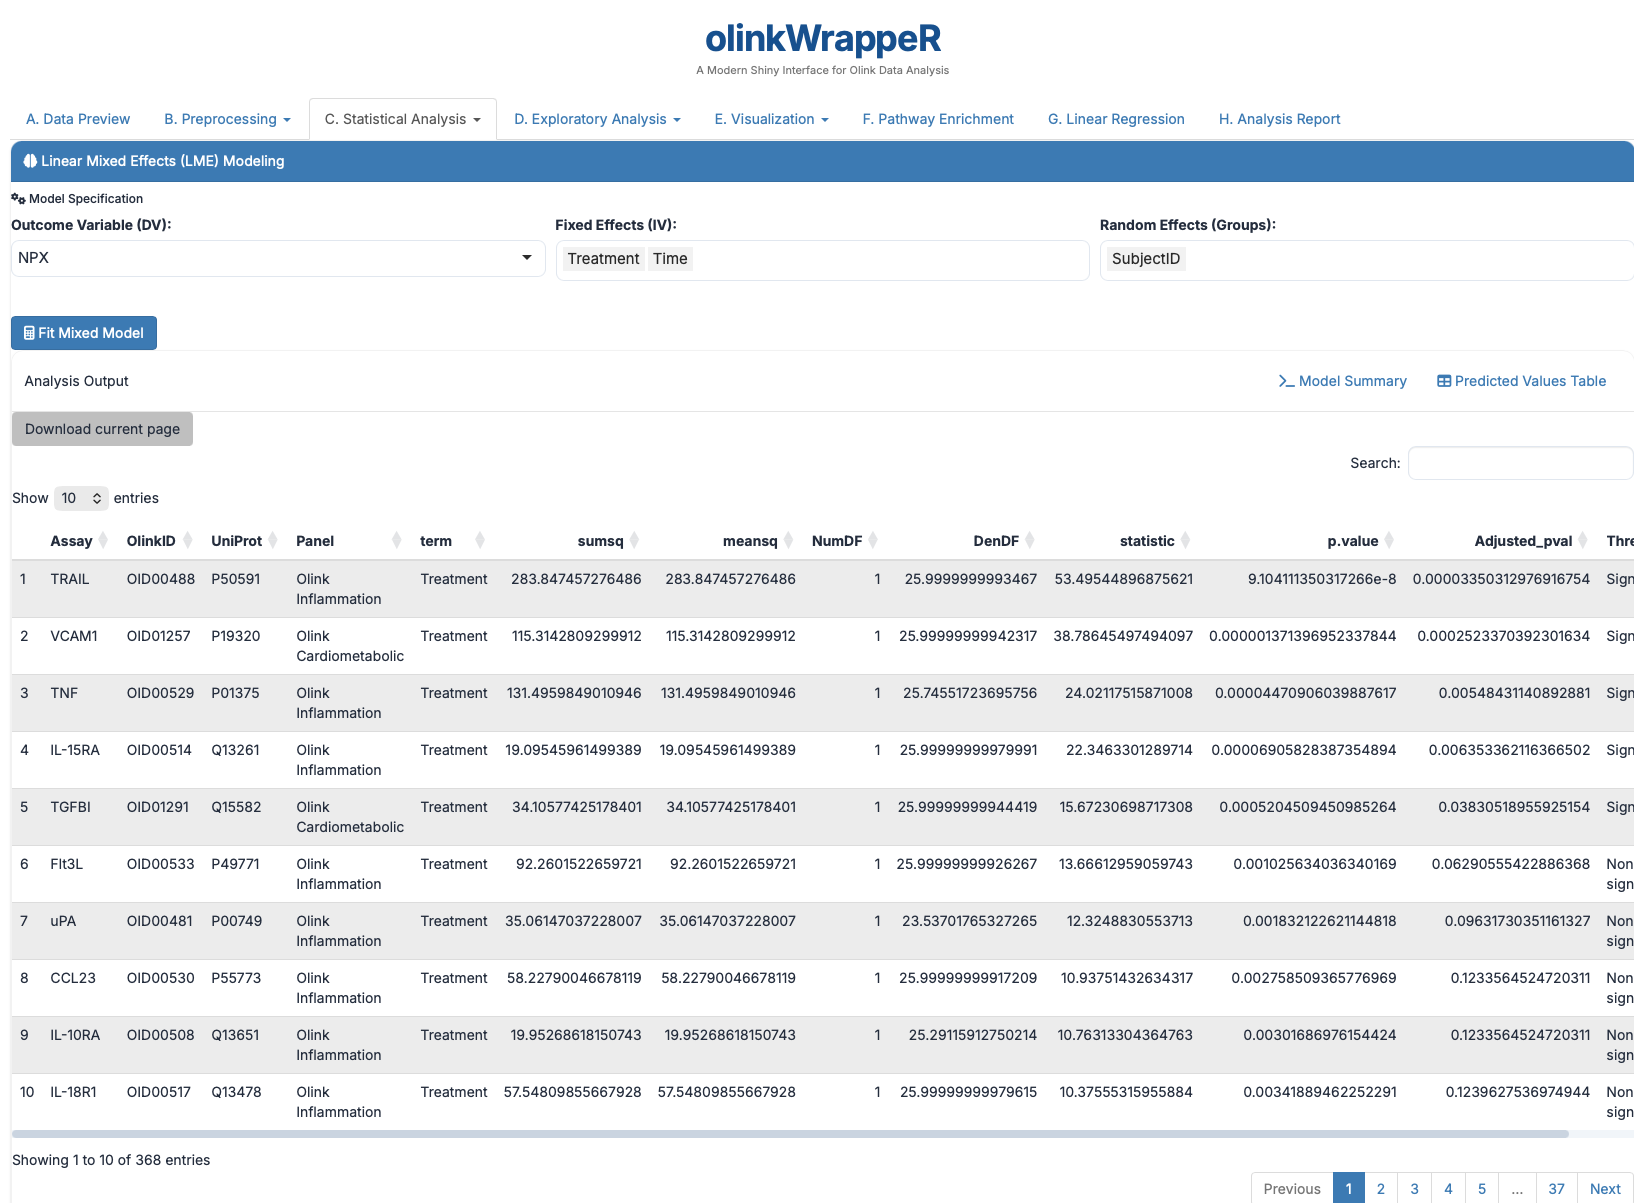
Interpretation of LME
A tibble with the following columns:
- Assay
: Assay name. - OlinkID
: Unique Olink ID. - UniProt
: UniProt ID. - Panel
: Olink Panel. - term
: Name of the variable that was used for the p-value calculation. The “:” between variables indicates interaction between variables. - sumsq
: Sum of squares. - meansq
: Mean of squares. - NumDF
: Numerator of degrees of freedom. - DenDF
: Denominator of degrees of freedom. - statistic
: Value of F-statistic. - p.value
: P-value for the test. - Adjusted_pval
: Adjusted p-value for the test (Benjamini & Hochberg). - Threshold
: Text indication if assay is significant (adjusted p-value < 0.05).
C.8 LME Post-hoc
Detailed comparisons for your mixed effects models.
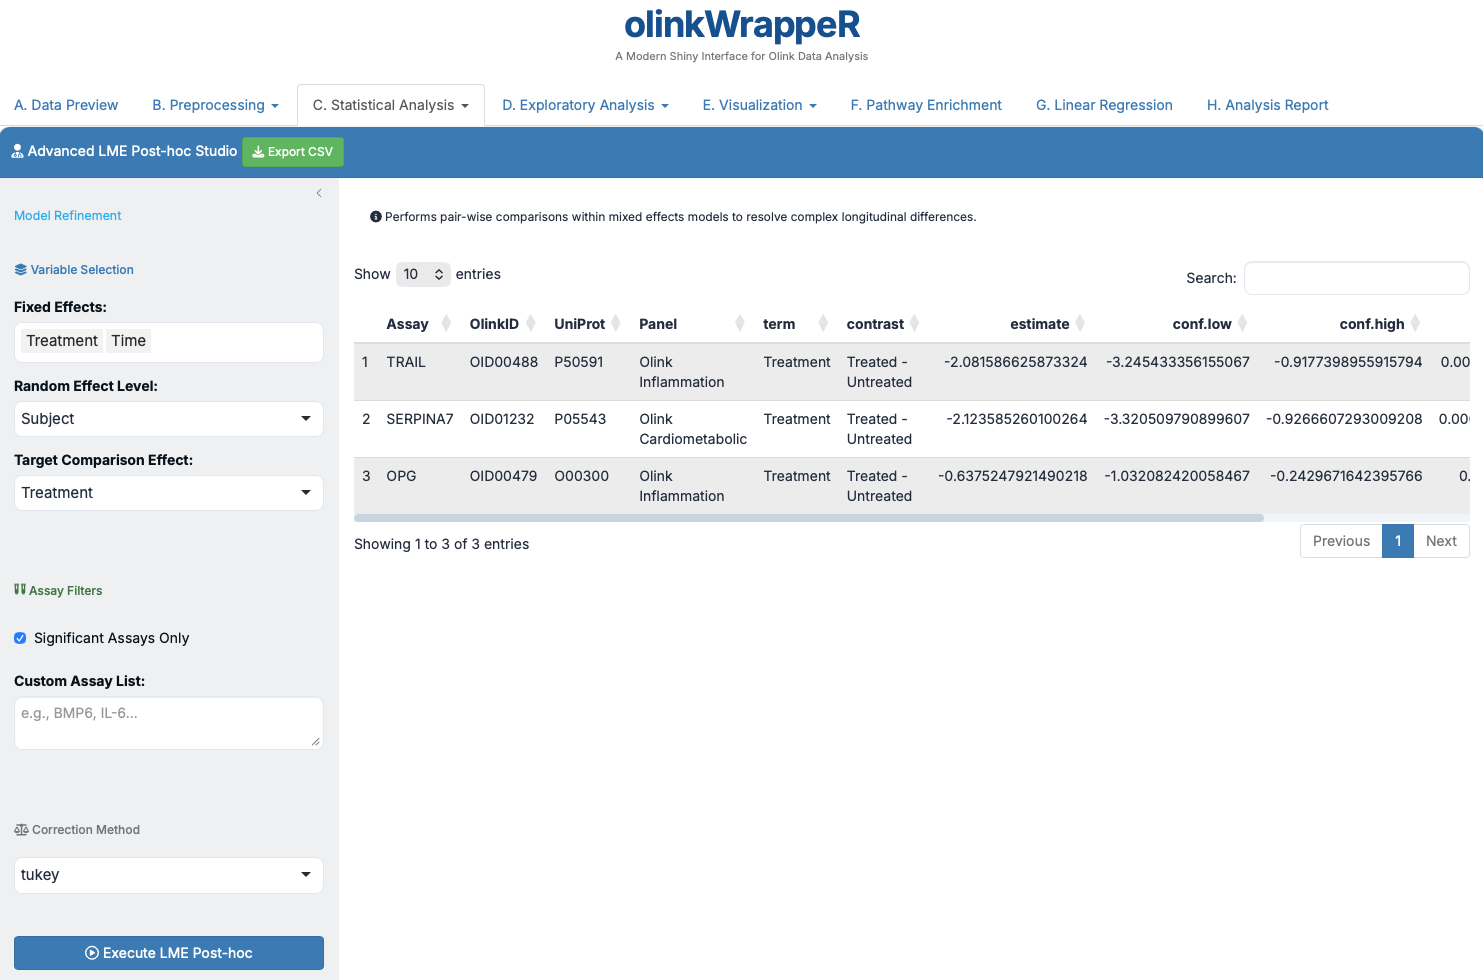
Interpretation of LME Post-hoc
A tibble with the following columns:
- Assay
: Assay name. - OlinkID
: Unique Olink ID. - UniProt
: UniProt ID. - Panel
: Olink Panel. - term
: Name of the variable that was used for the p-value calculation. The “:” between variables indicates interaction between variables. - contrast
: Variables (in term) that are compared. - estimate
: Difference in mean NPX between variables (from contrast). - conf.low
: Low bound of the confidence interval for the mean. - conf.high
: High bound of the confidence interval for the mean. - Adjusted_pval
: Adjusted p-value for the test (Benjamini & Hochberg). - Threshold
: Text indication if assay is significant (adjusted p-value < 0.05).
D. Exploratory Analysis
D.1 UMAP
Visualizes high-dimensional protein data in 2D space.
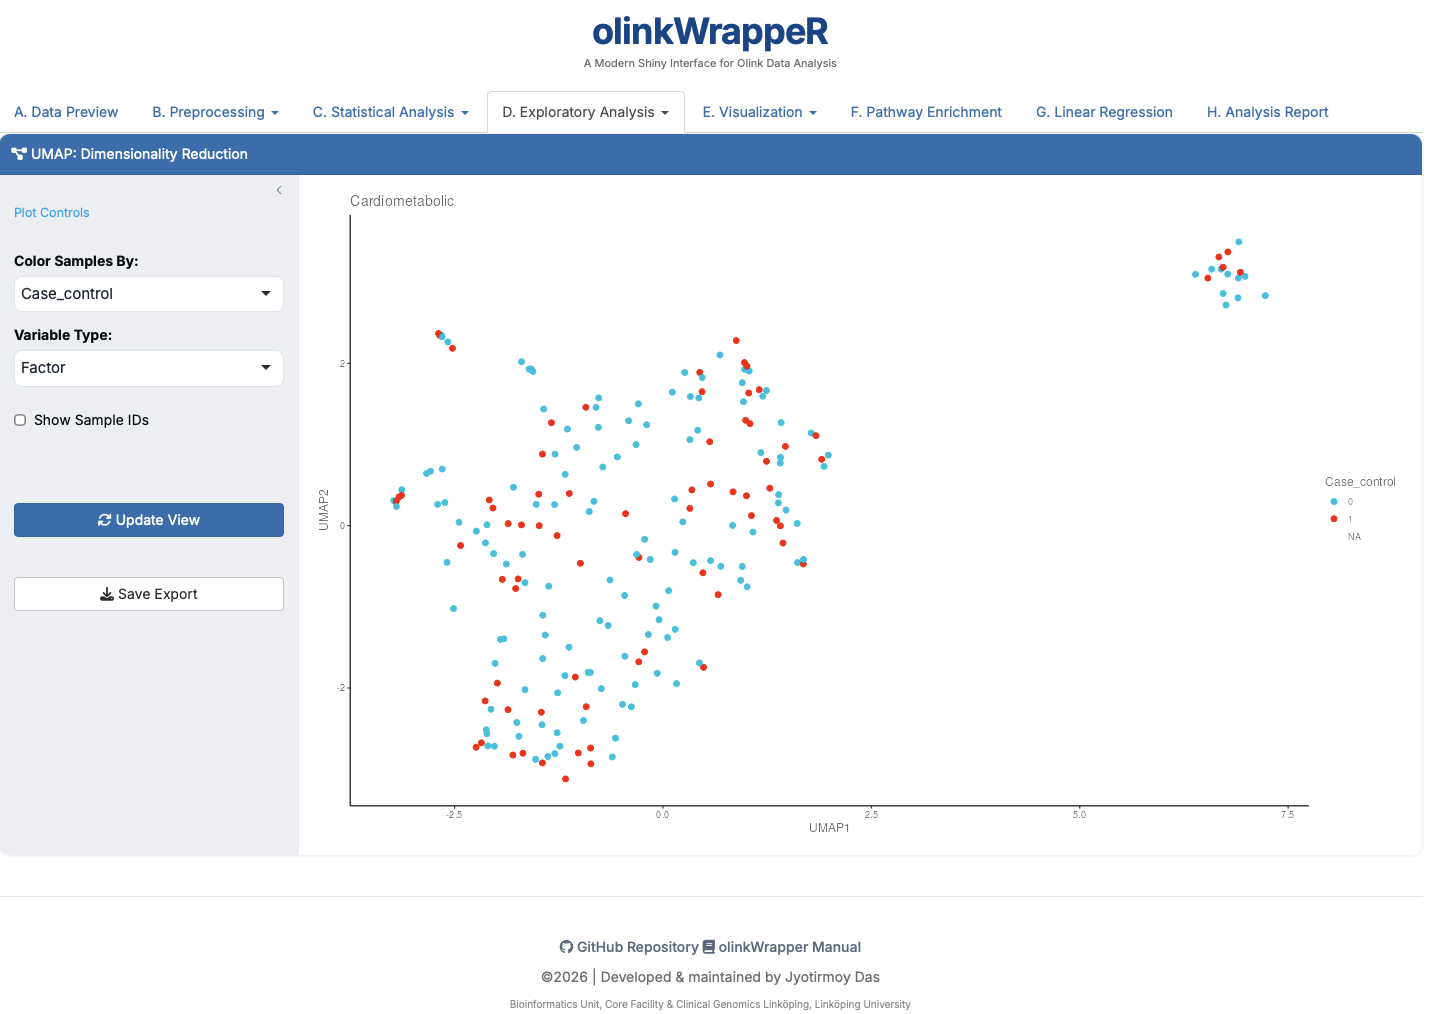
- Interpretation: Points that are closer together have more similar proteomic profiles. Ideal for identifying global group separations.
D.2 PCA
Standard Principal Component Analysis.
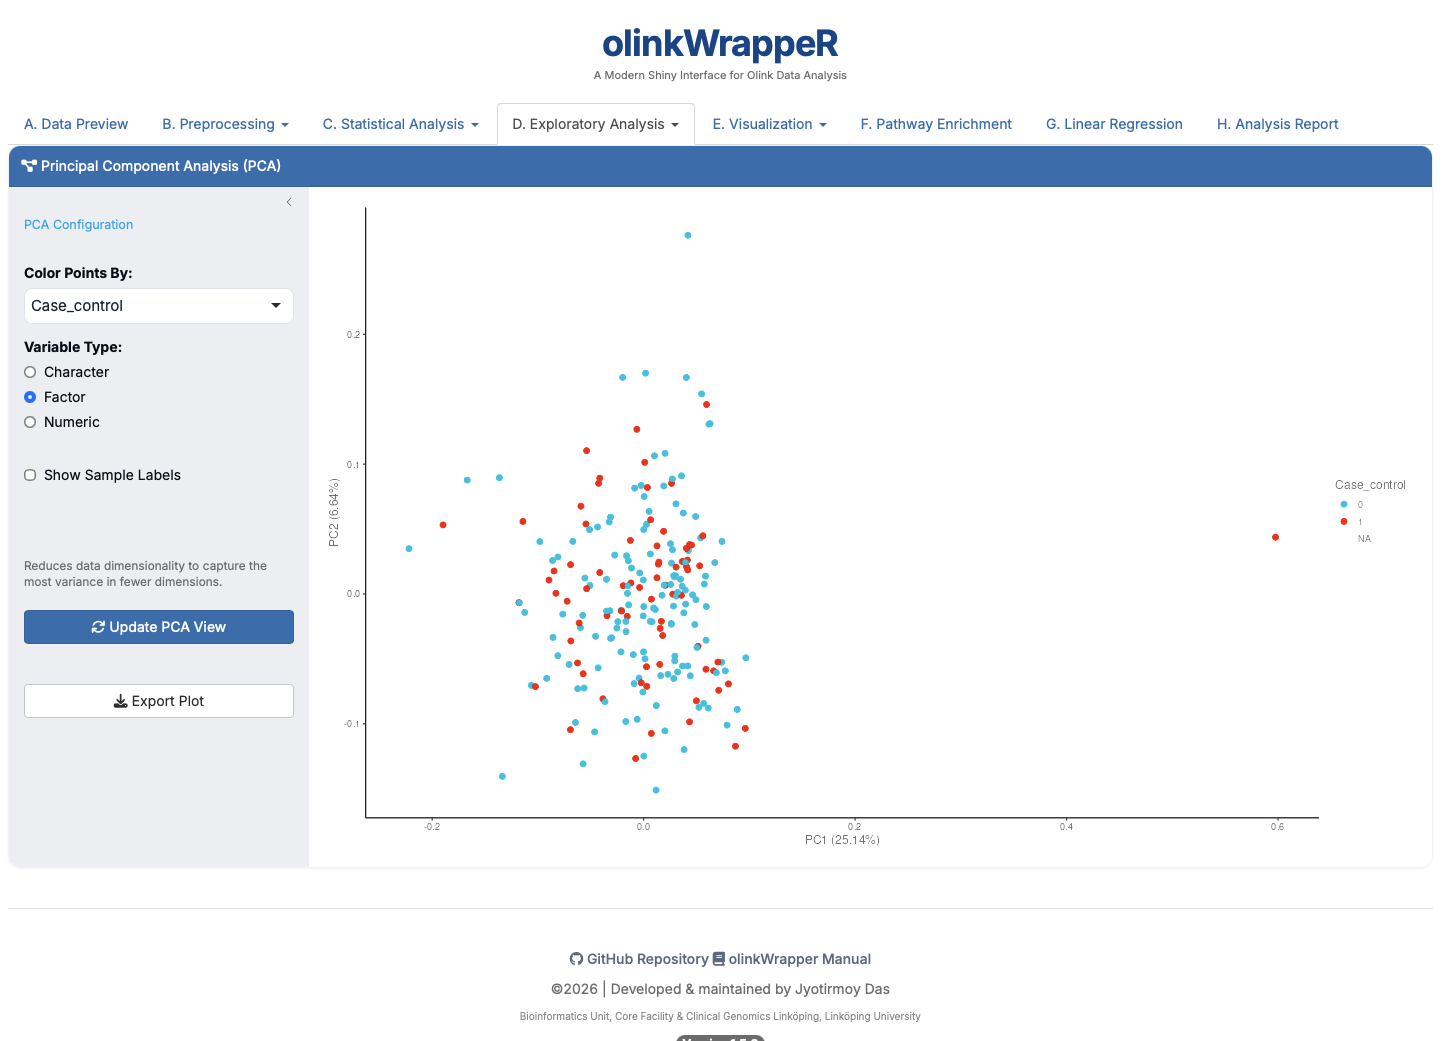
- Interpretation: The X and Y axes show the percentage of variance explained by the first two components.
E. Visualization
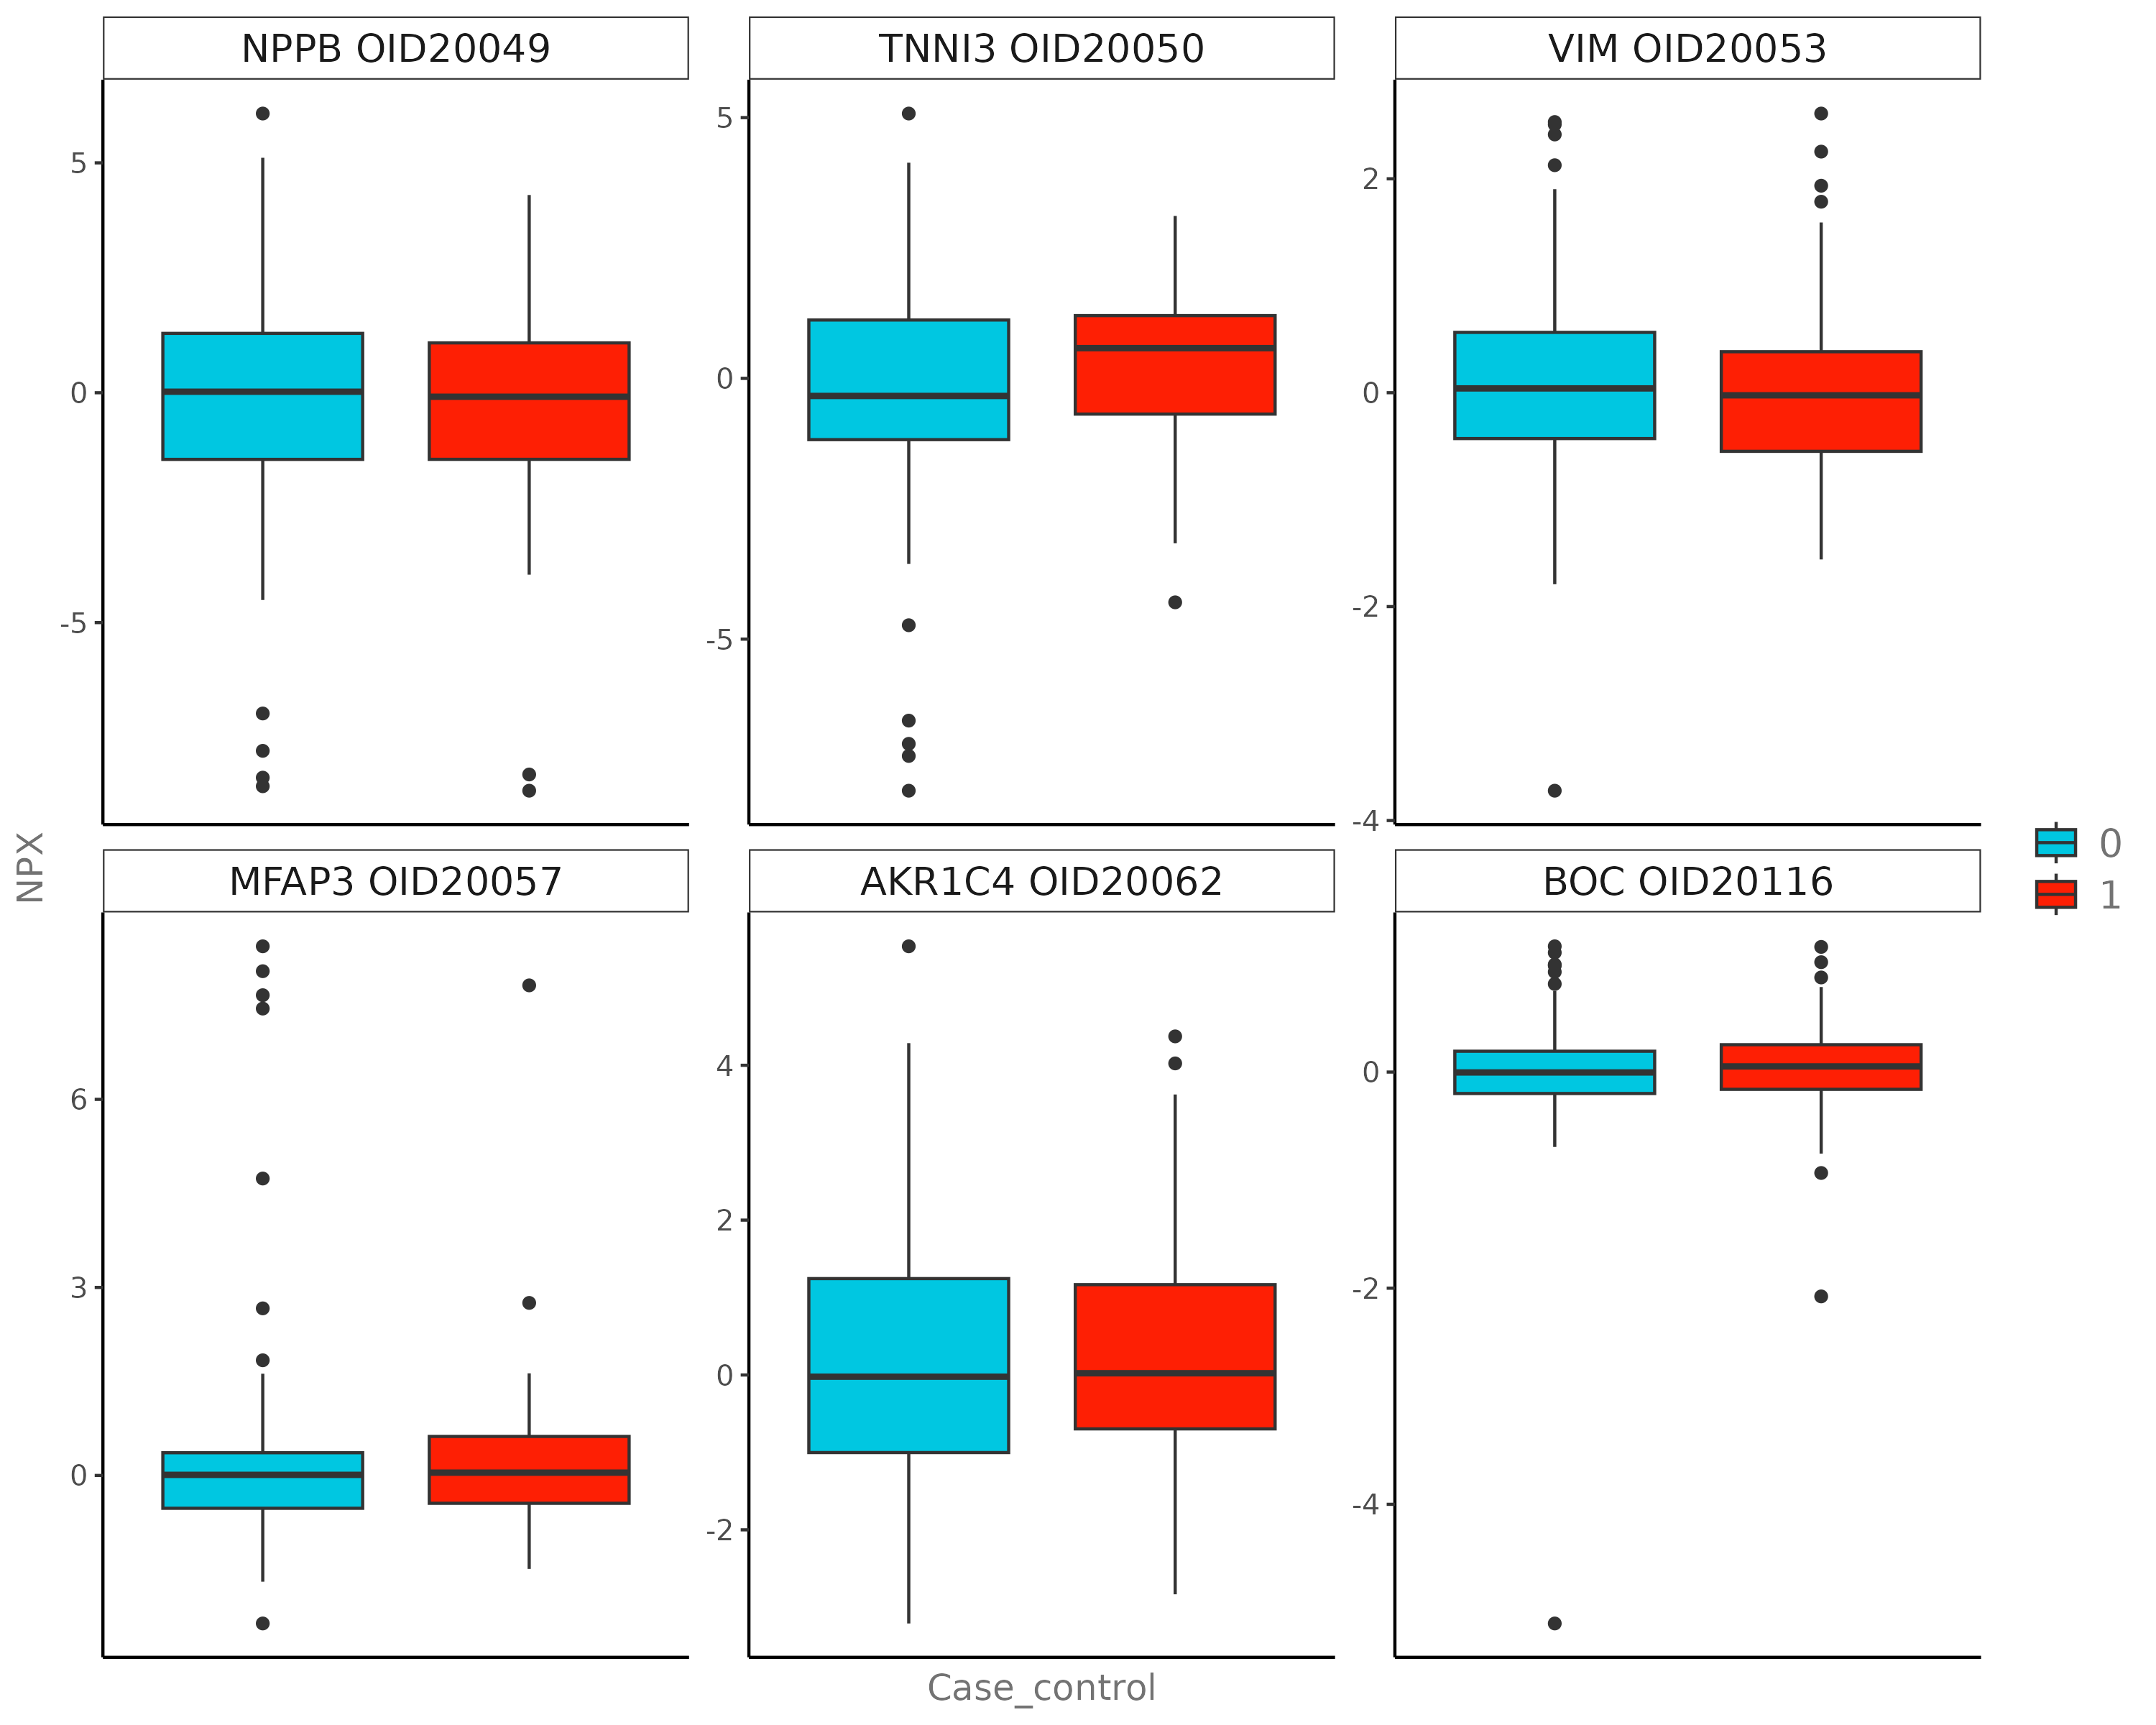
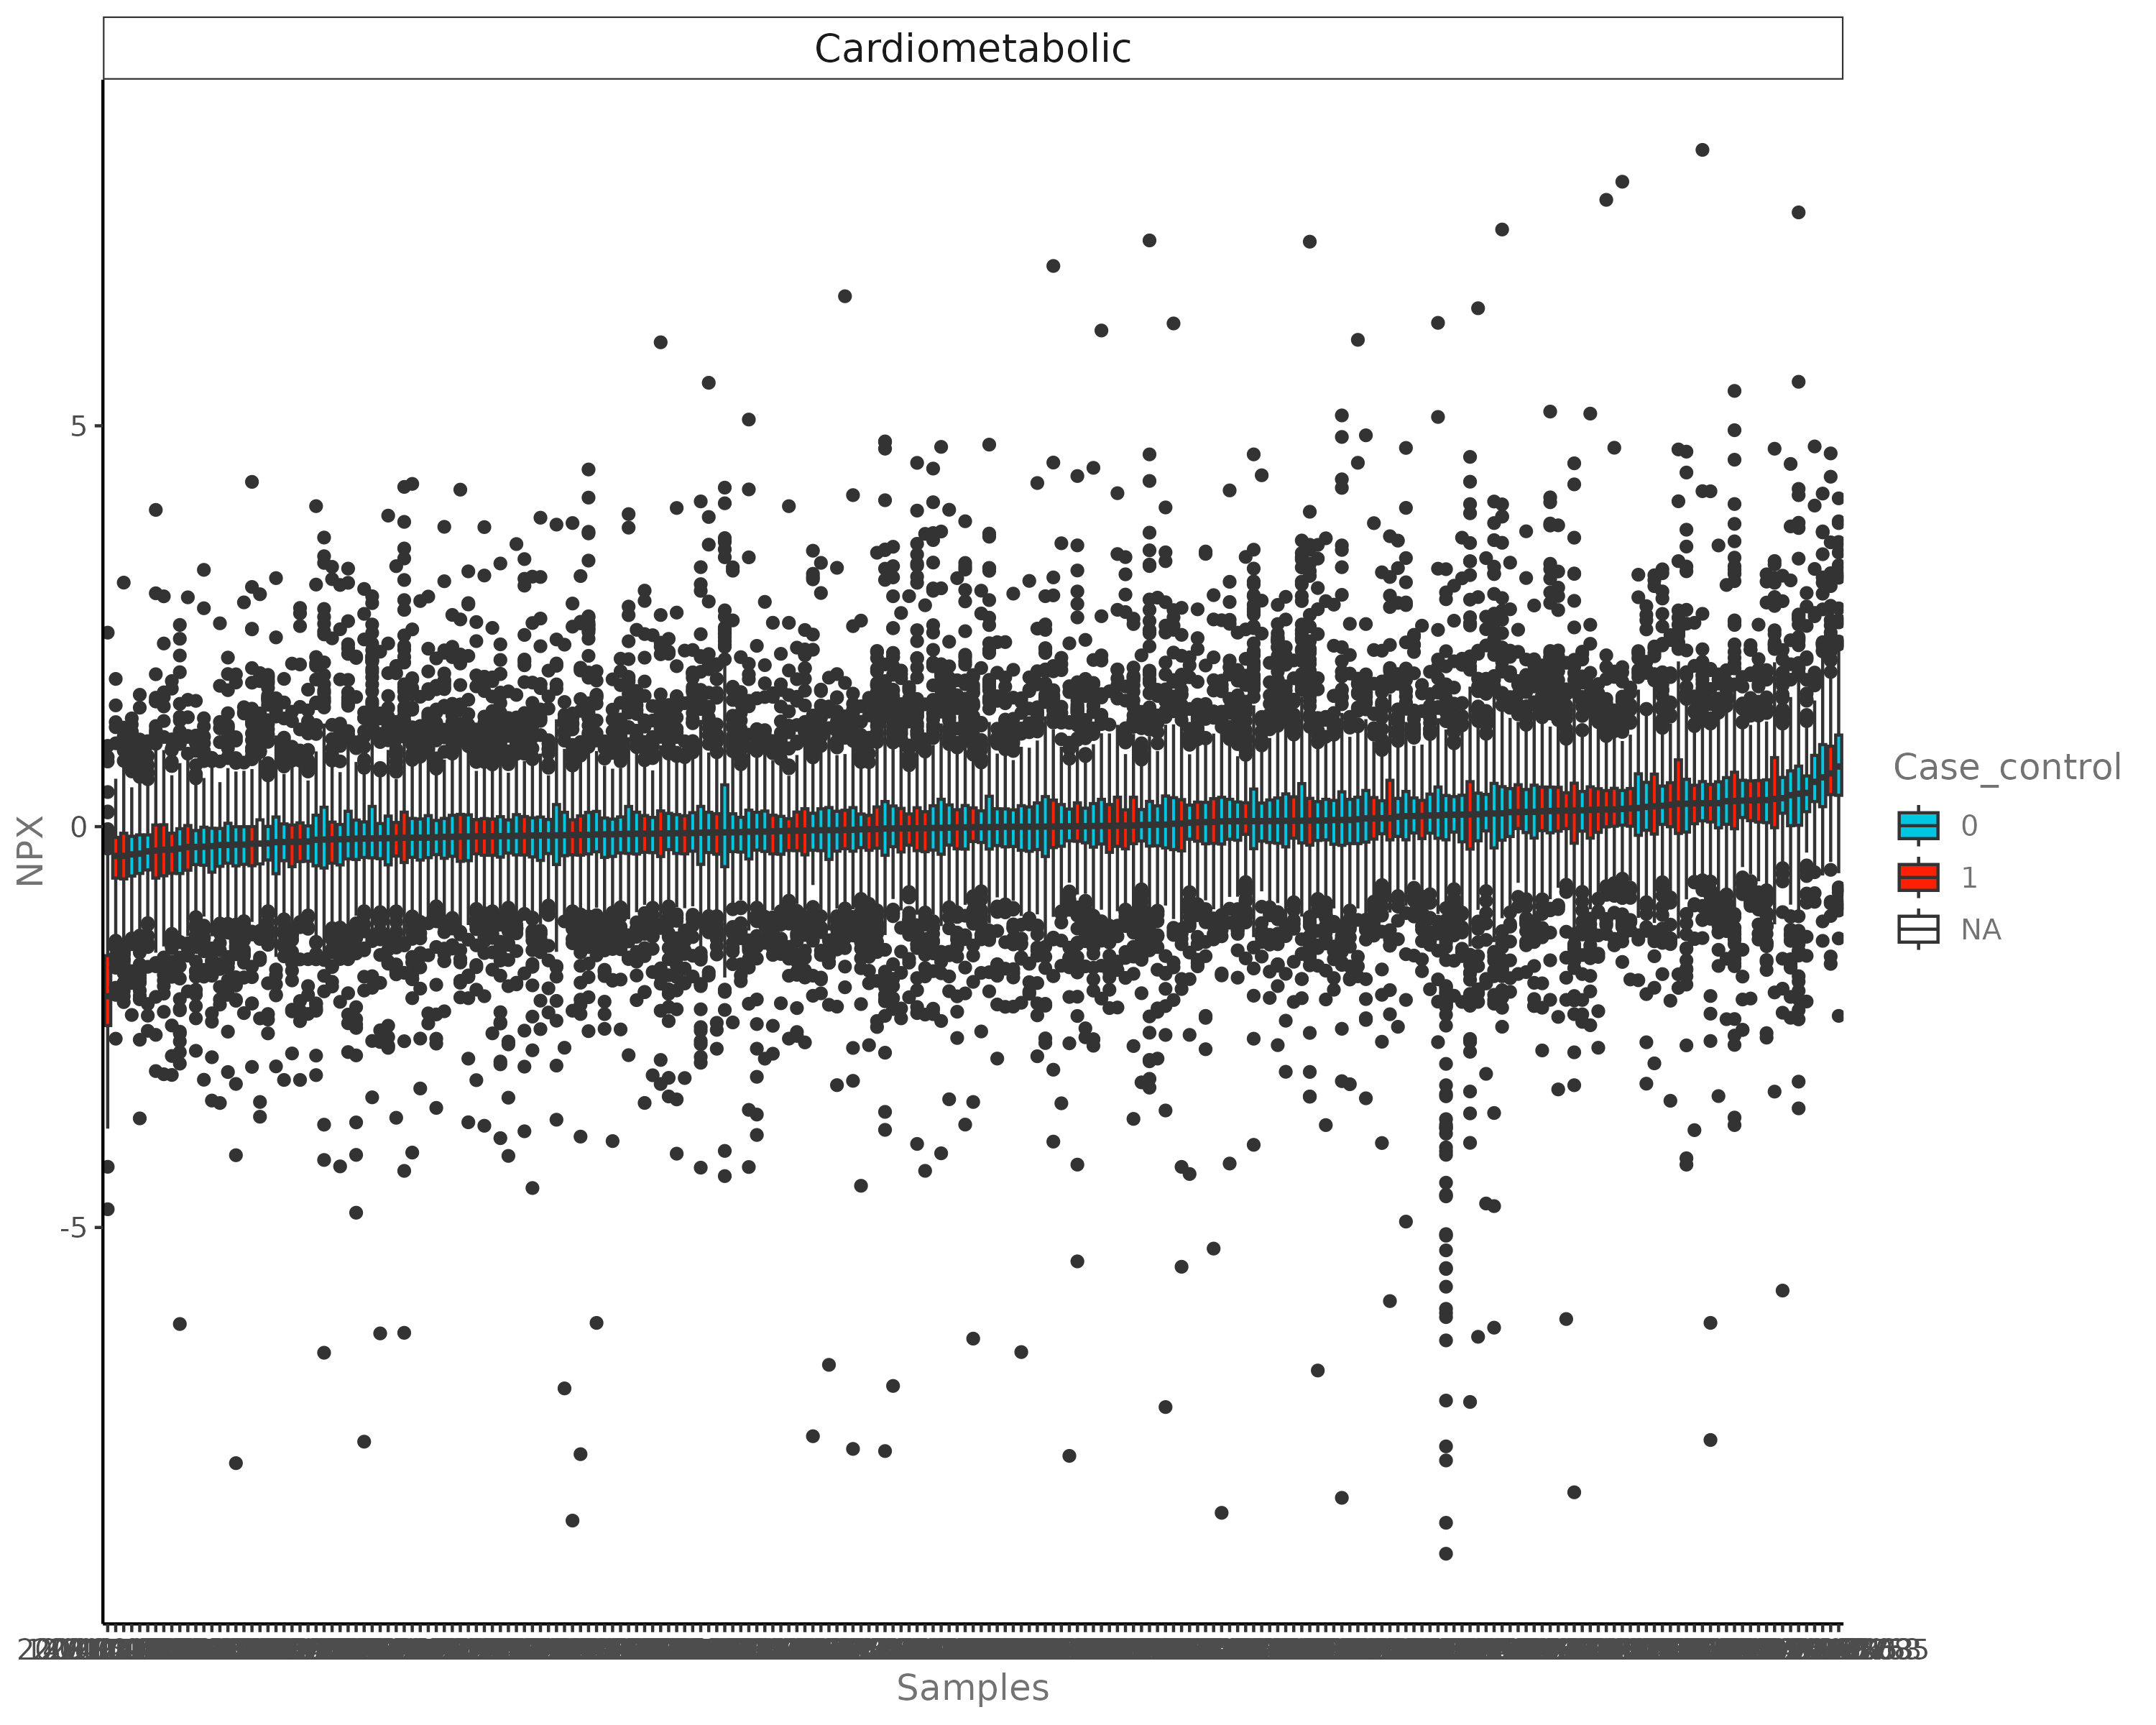
E.1 Boxplot
Visualizes group distributions for a single protein.
E.2 Distribution Plot
Density or Histogram views of the NPX data.
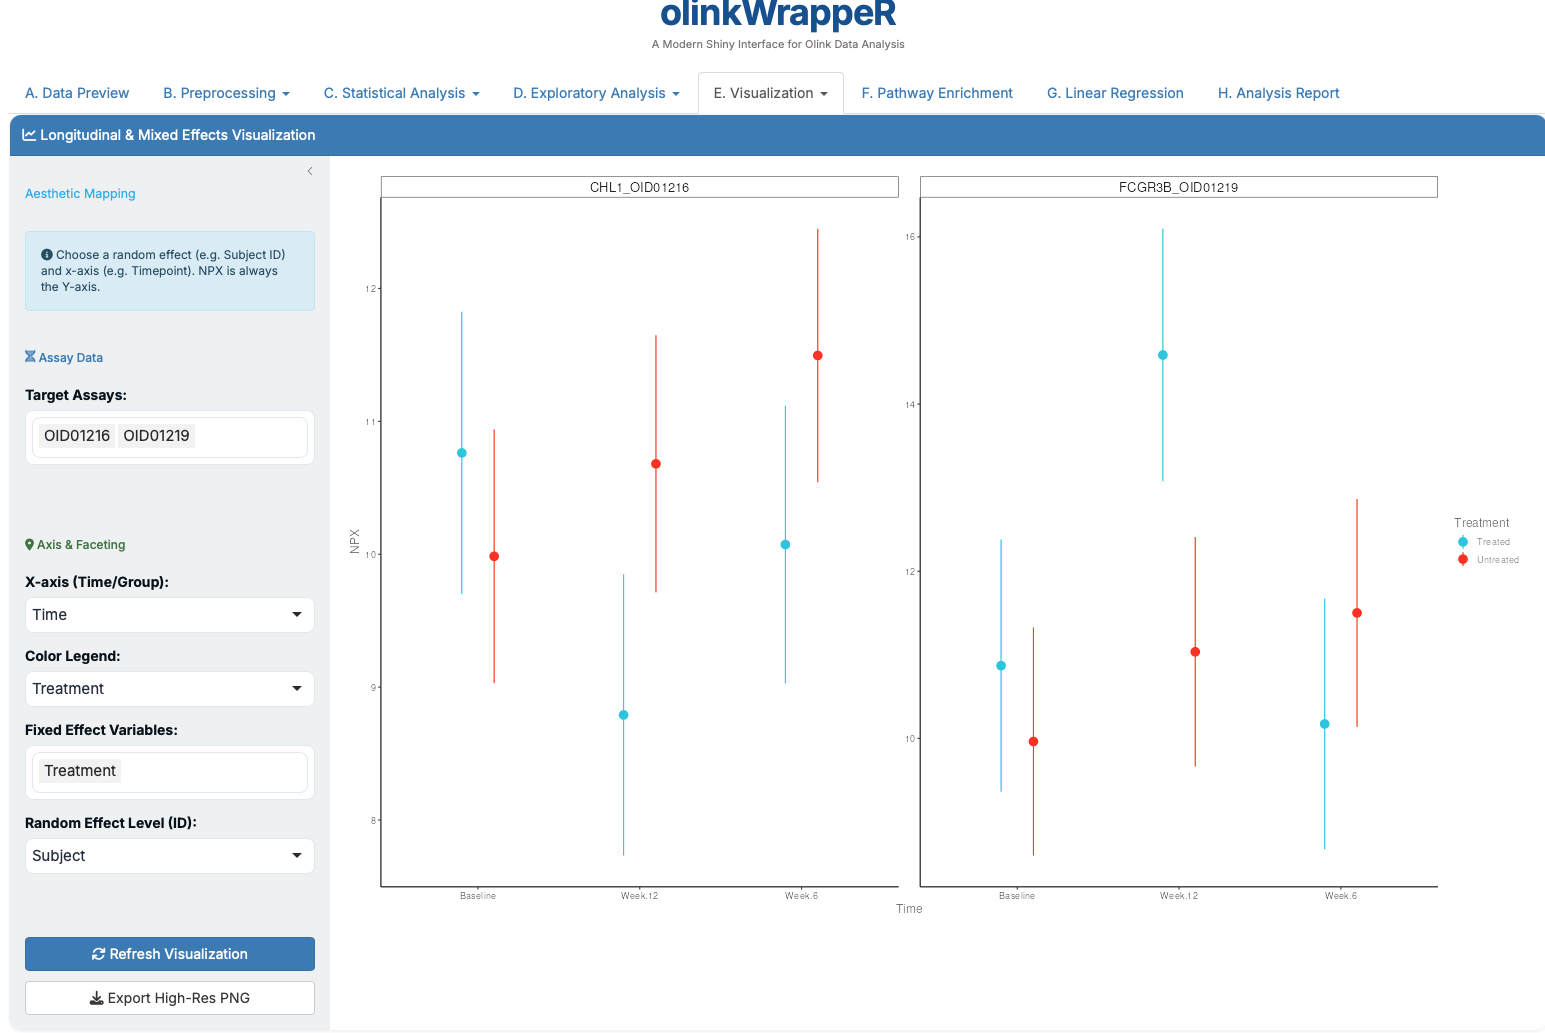
E.3 LME Plot
Plots changes over time or groups as predicted by Mixed Effects models.
E.4 Pathway Heatmap
Heatmap limited to proteins within specific biological pathways.
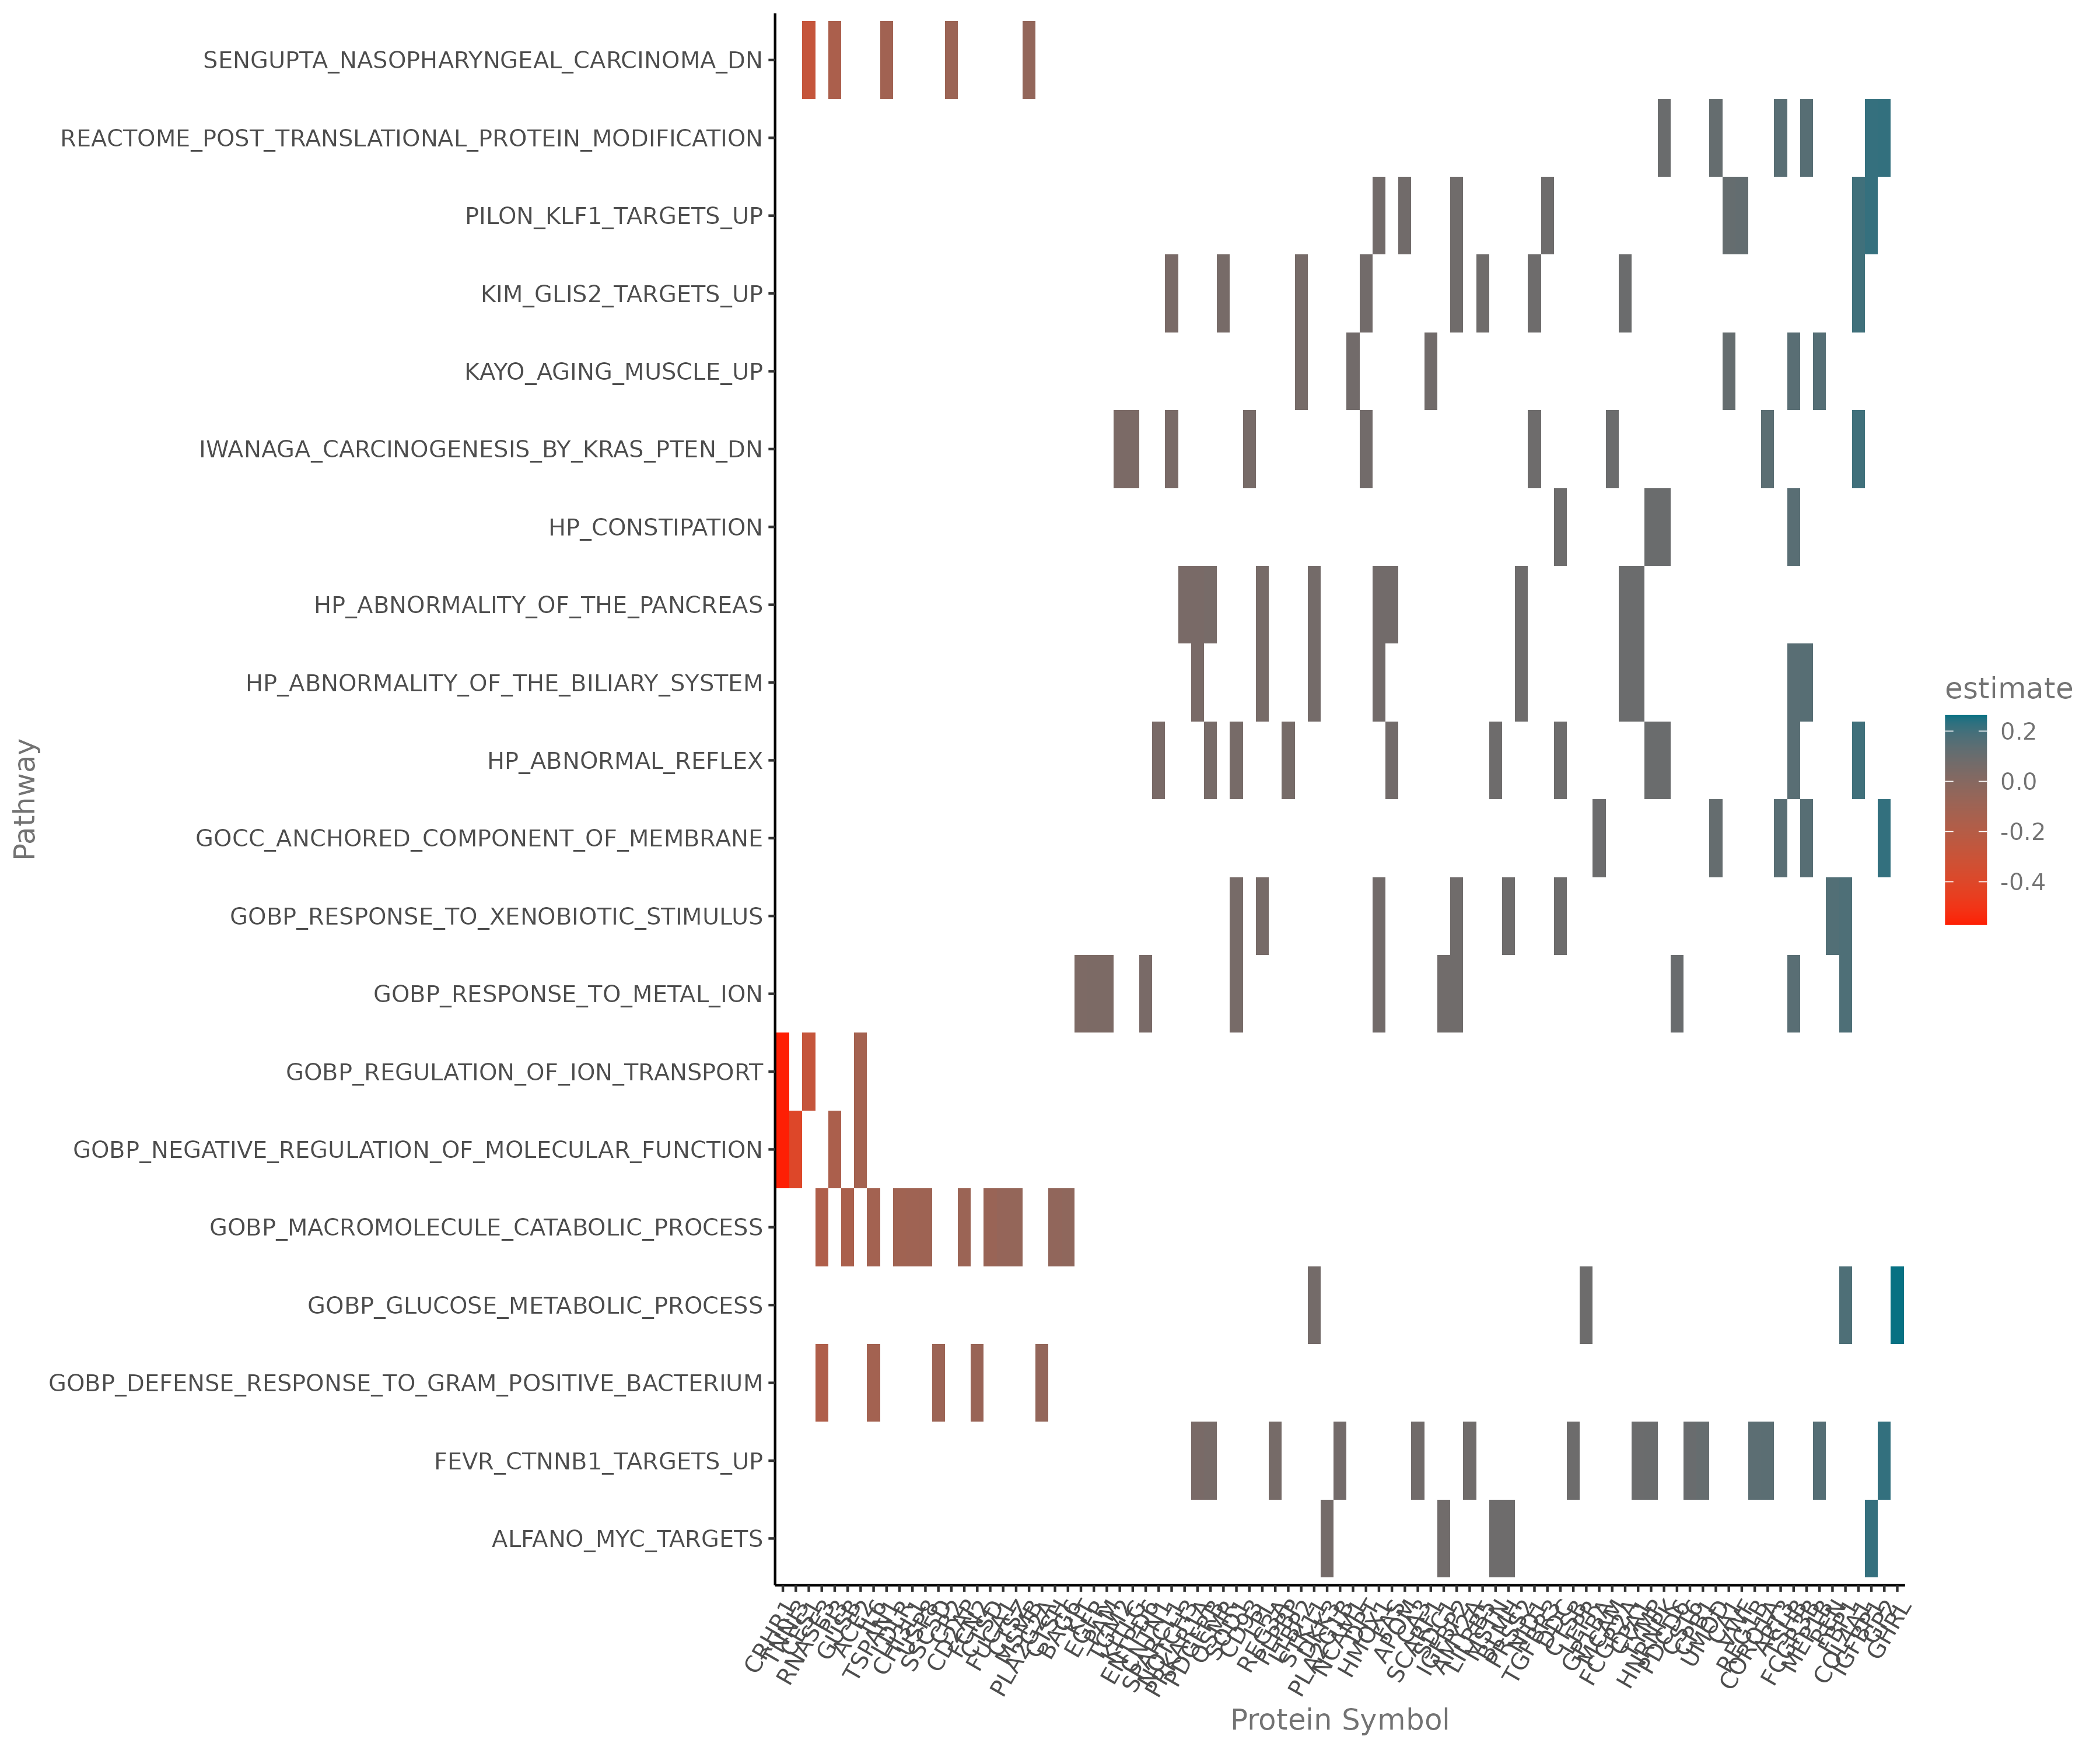
- Requirement: You must select specific pathways from the GSEA results to populate this plot.
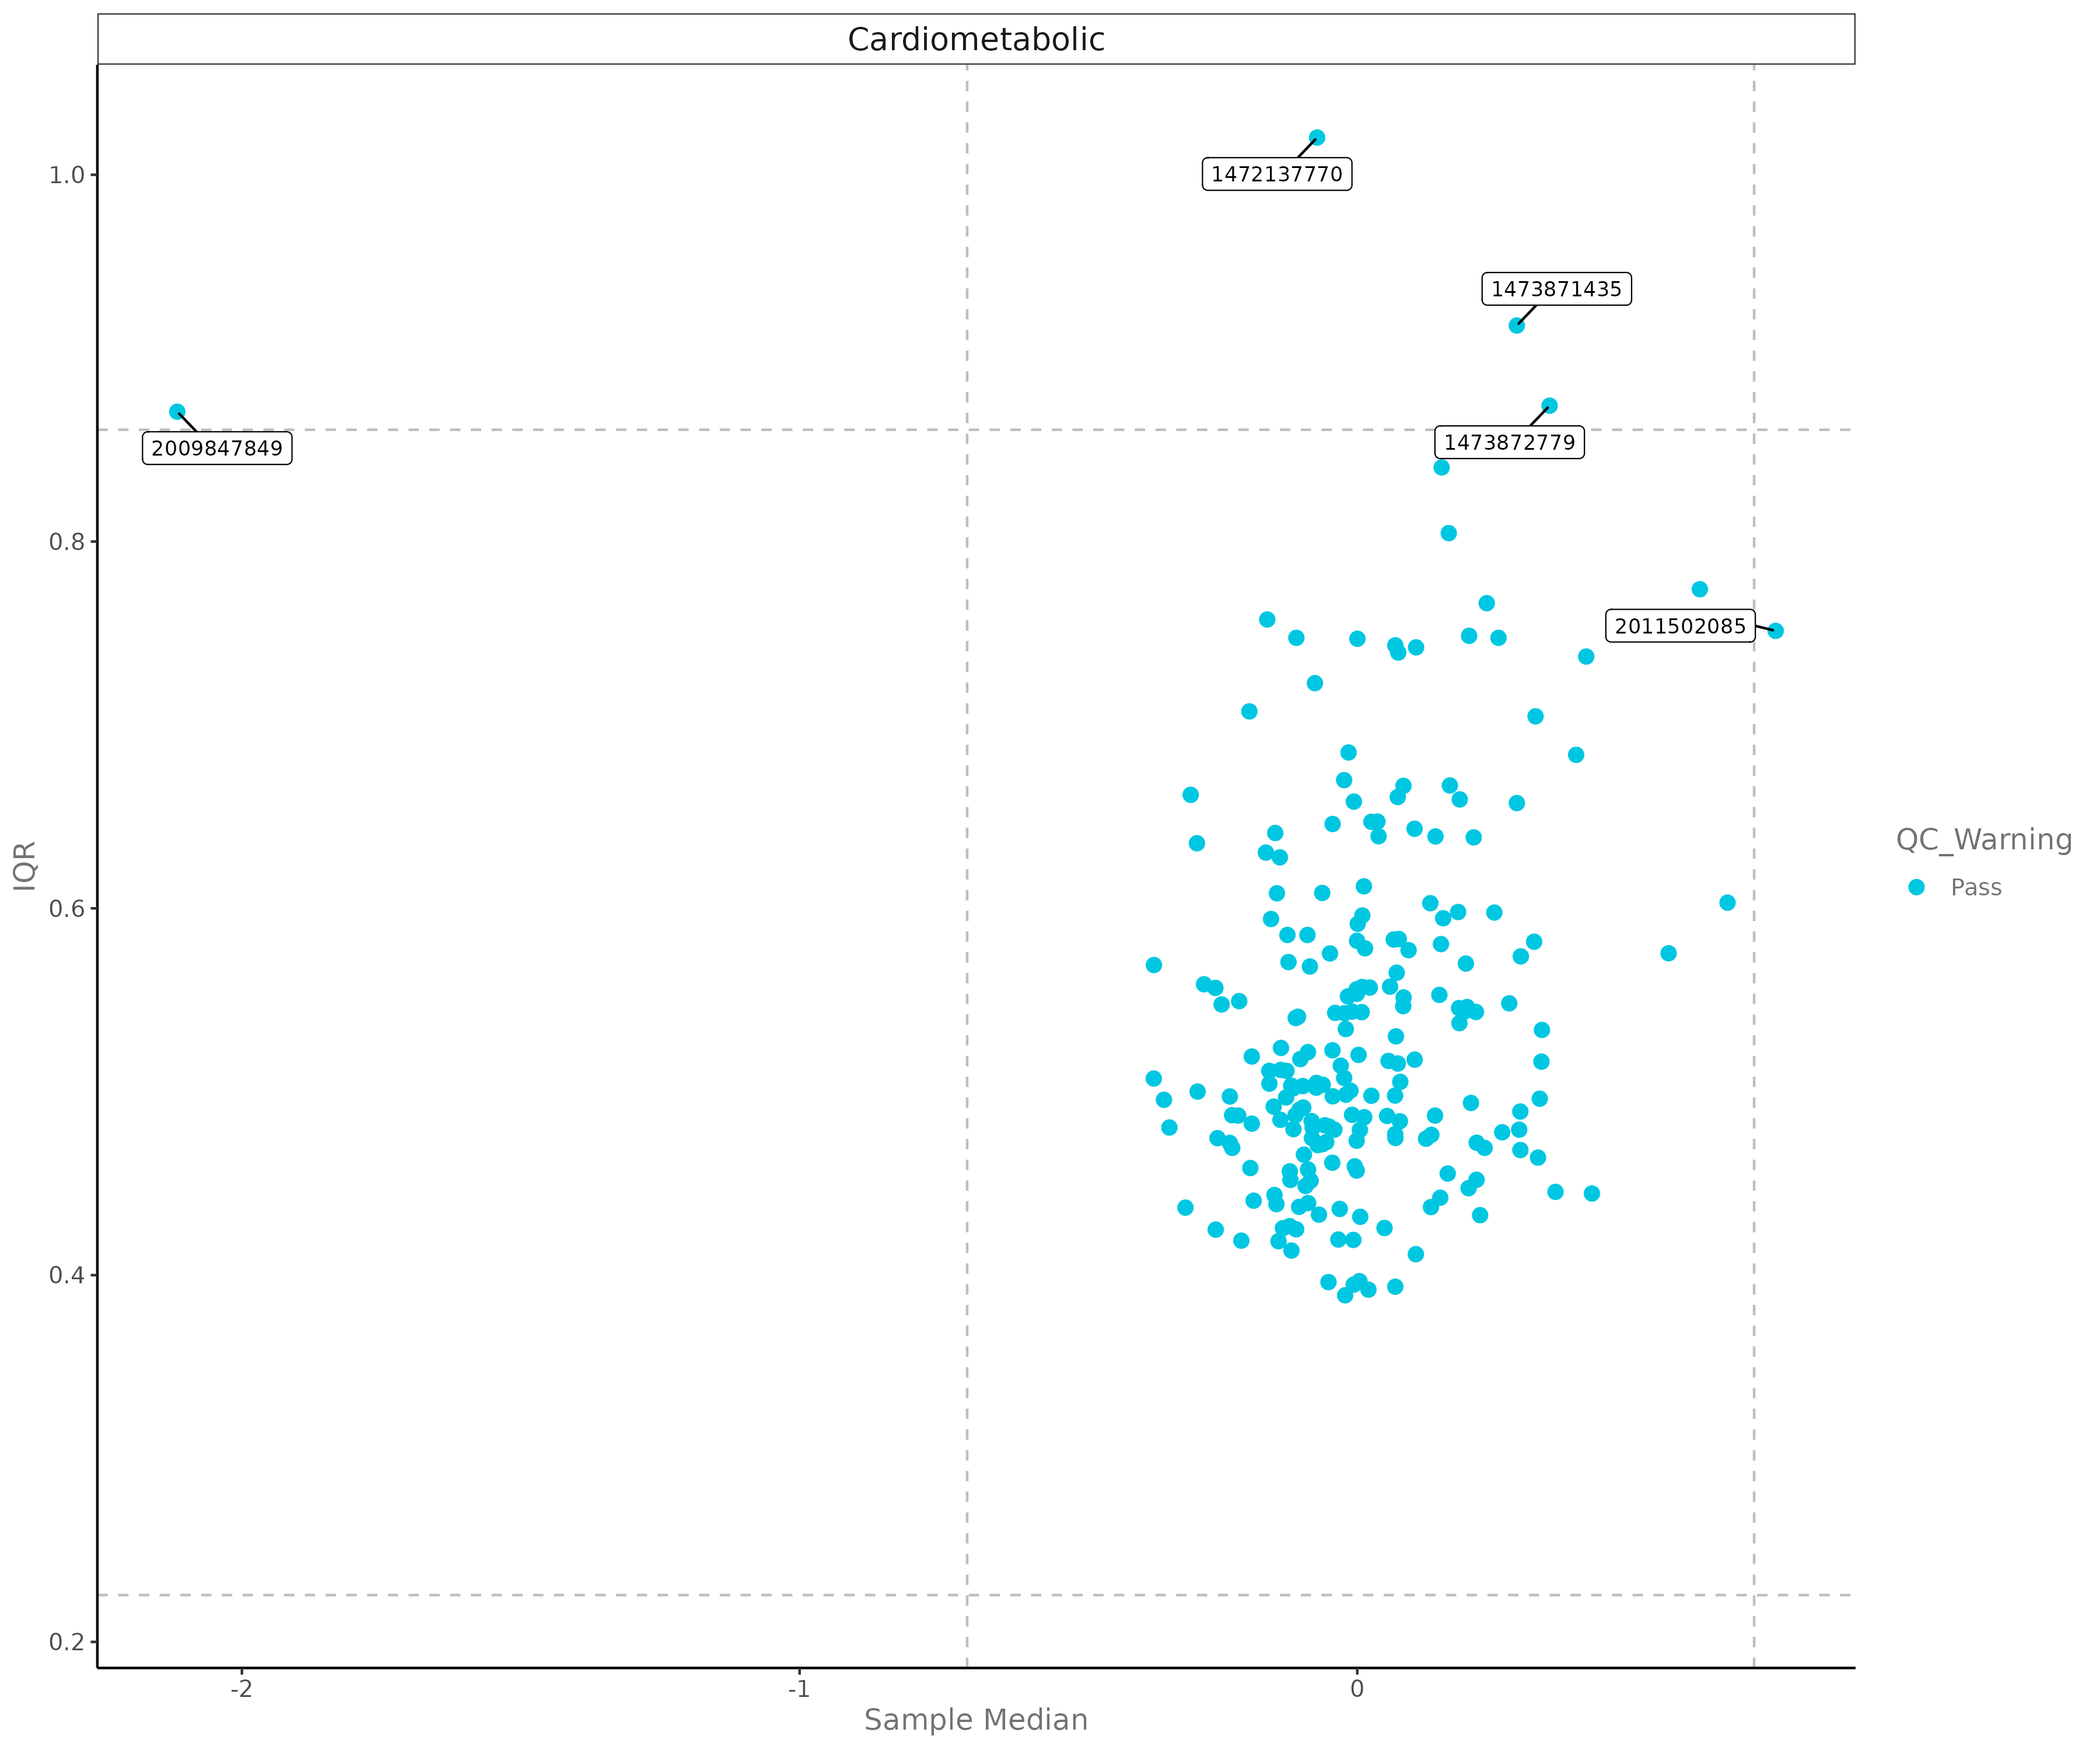
E.5 QC Plot
Analyzes data quality across panels and plates.
E.6 Heatmap
Global view of all protein expression across all samples.
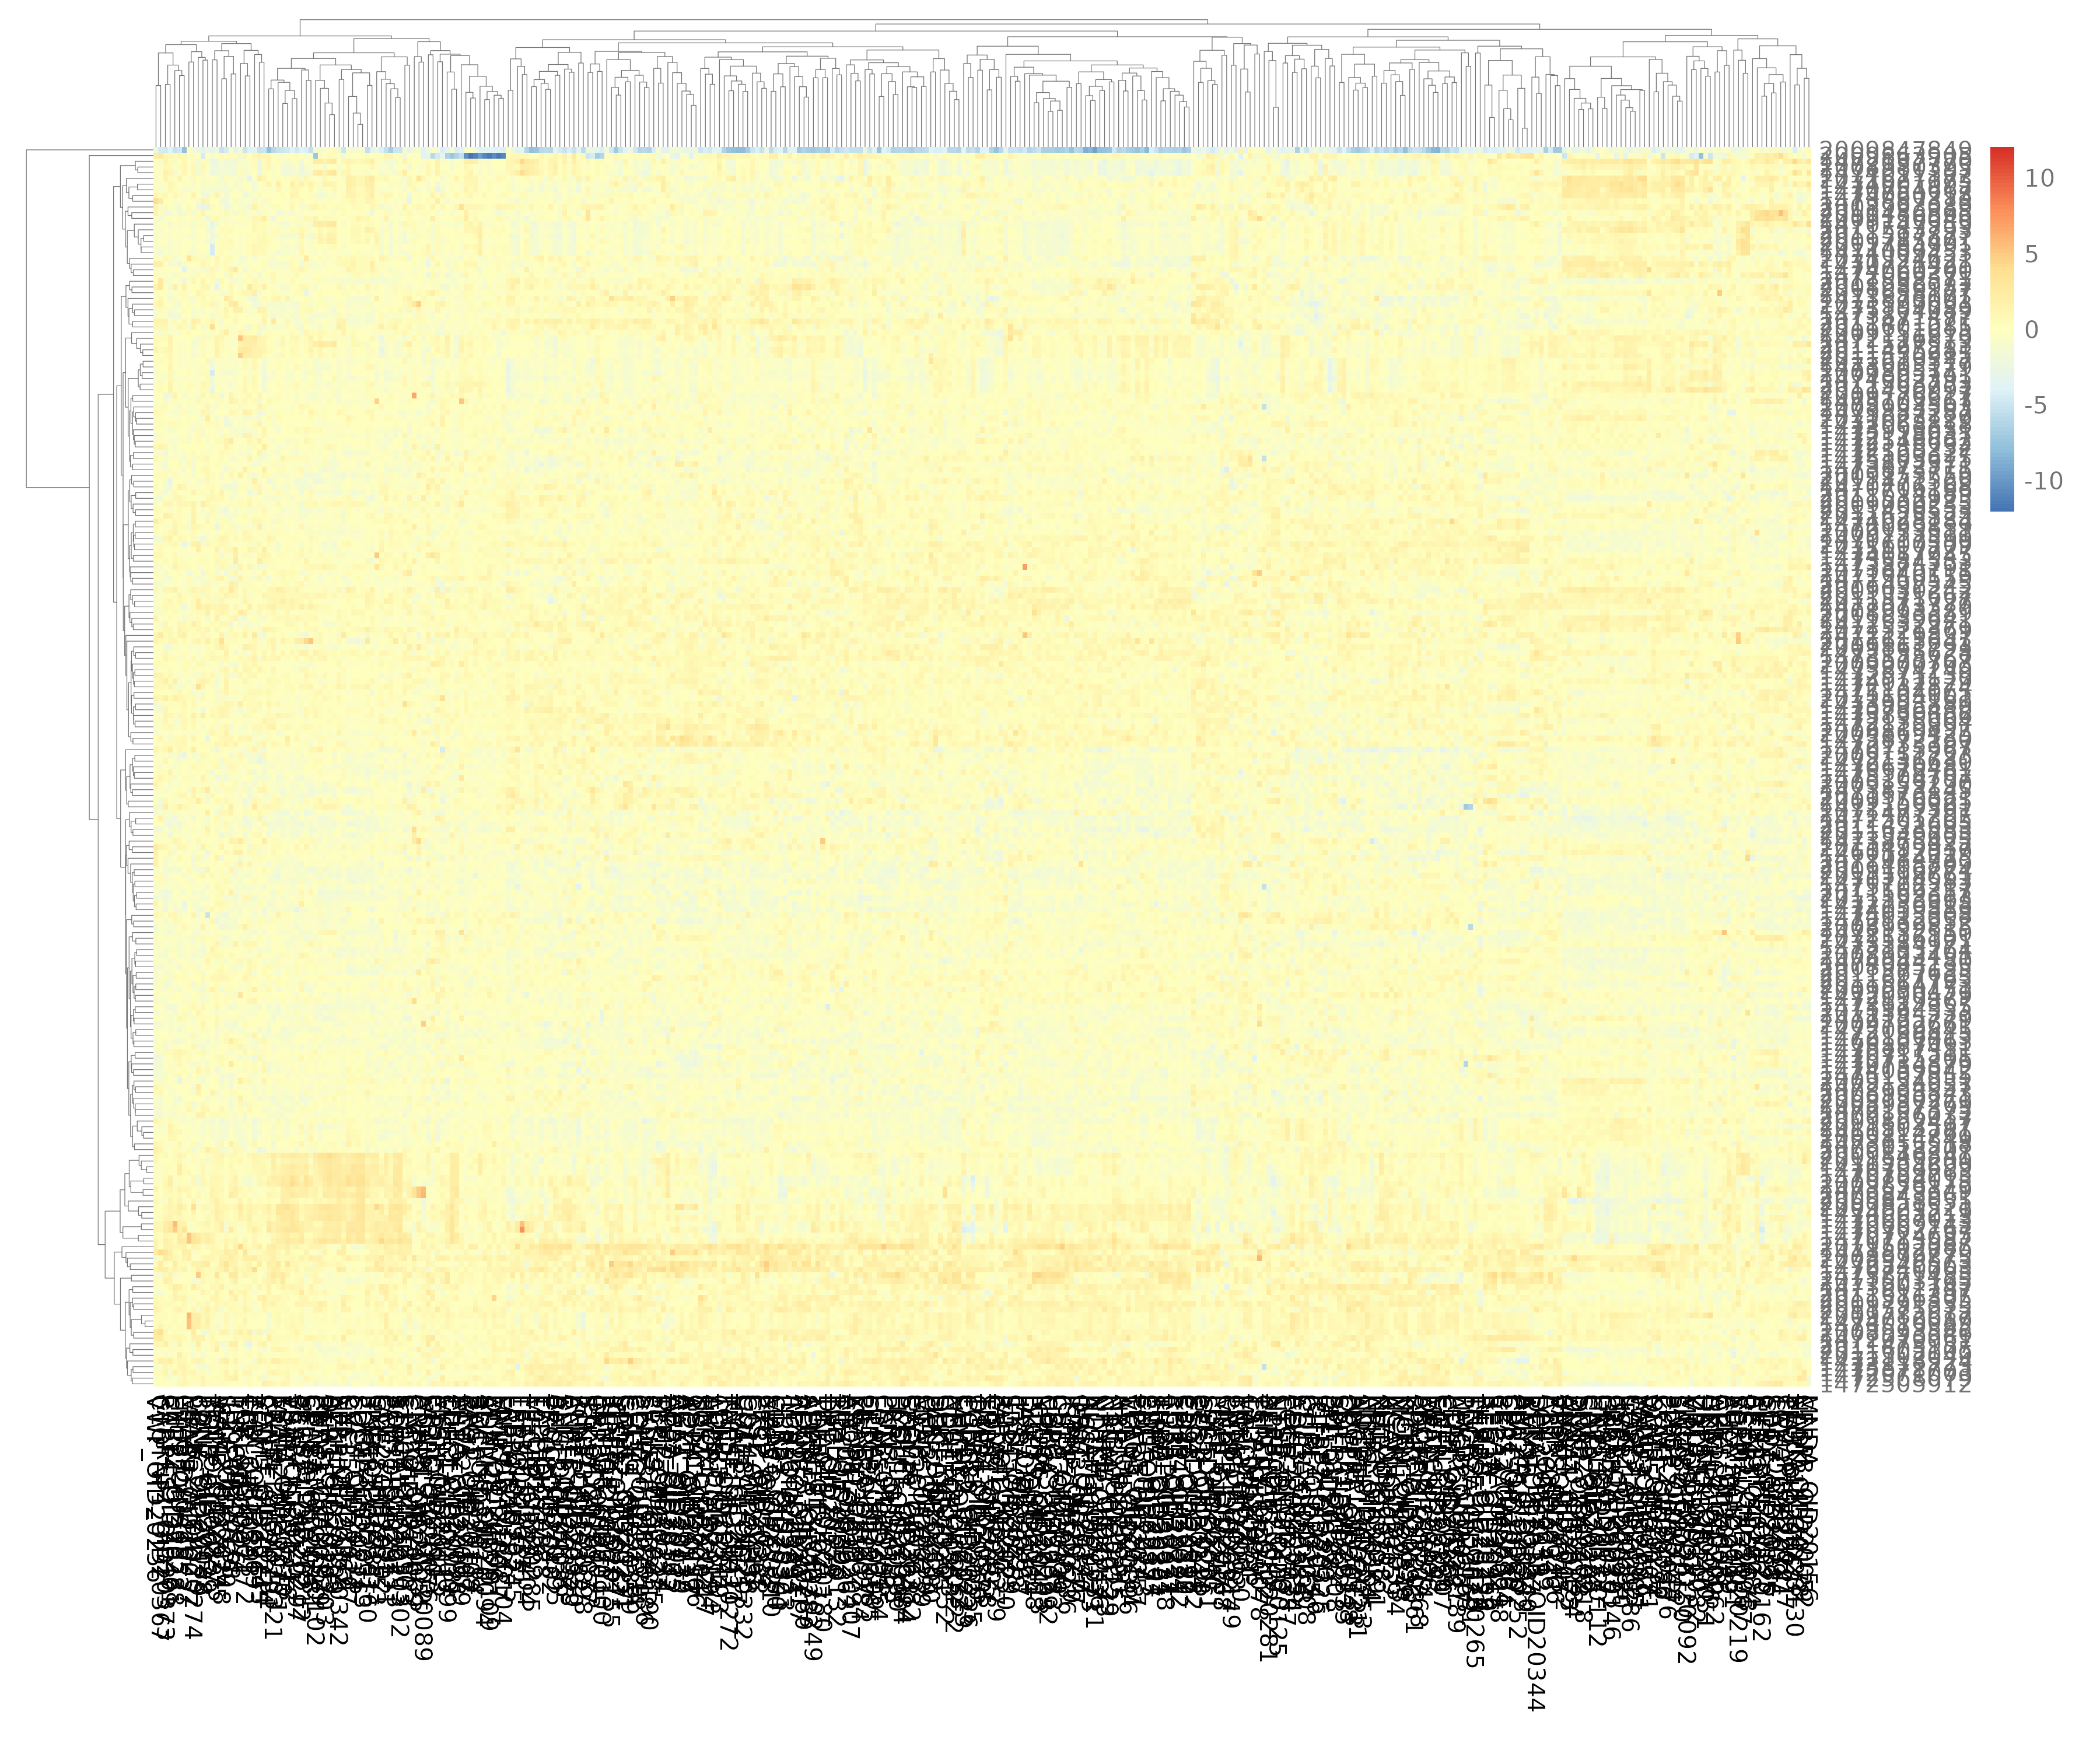
- Interpretation: High expression is colored red; low expression is colored blue.
E.7 Volcano Plot
Quickly identifies significant biomarkers.
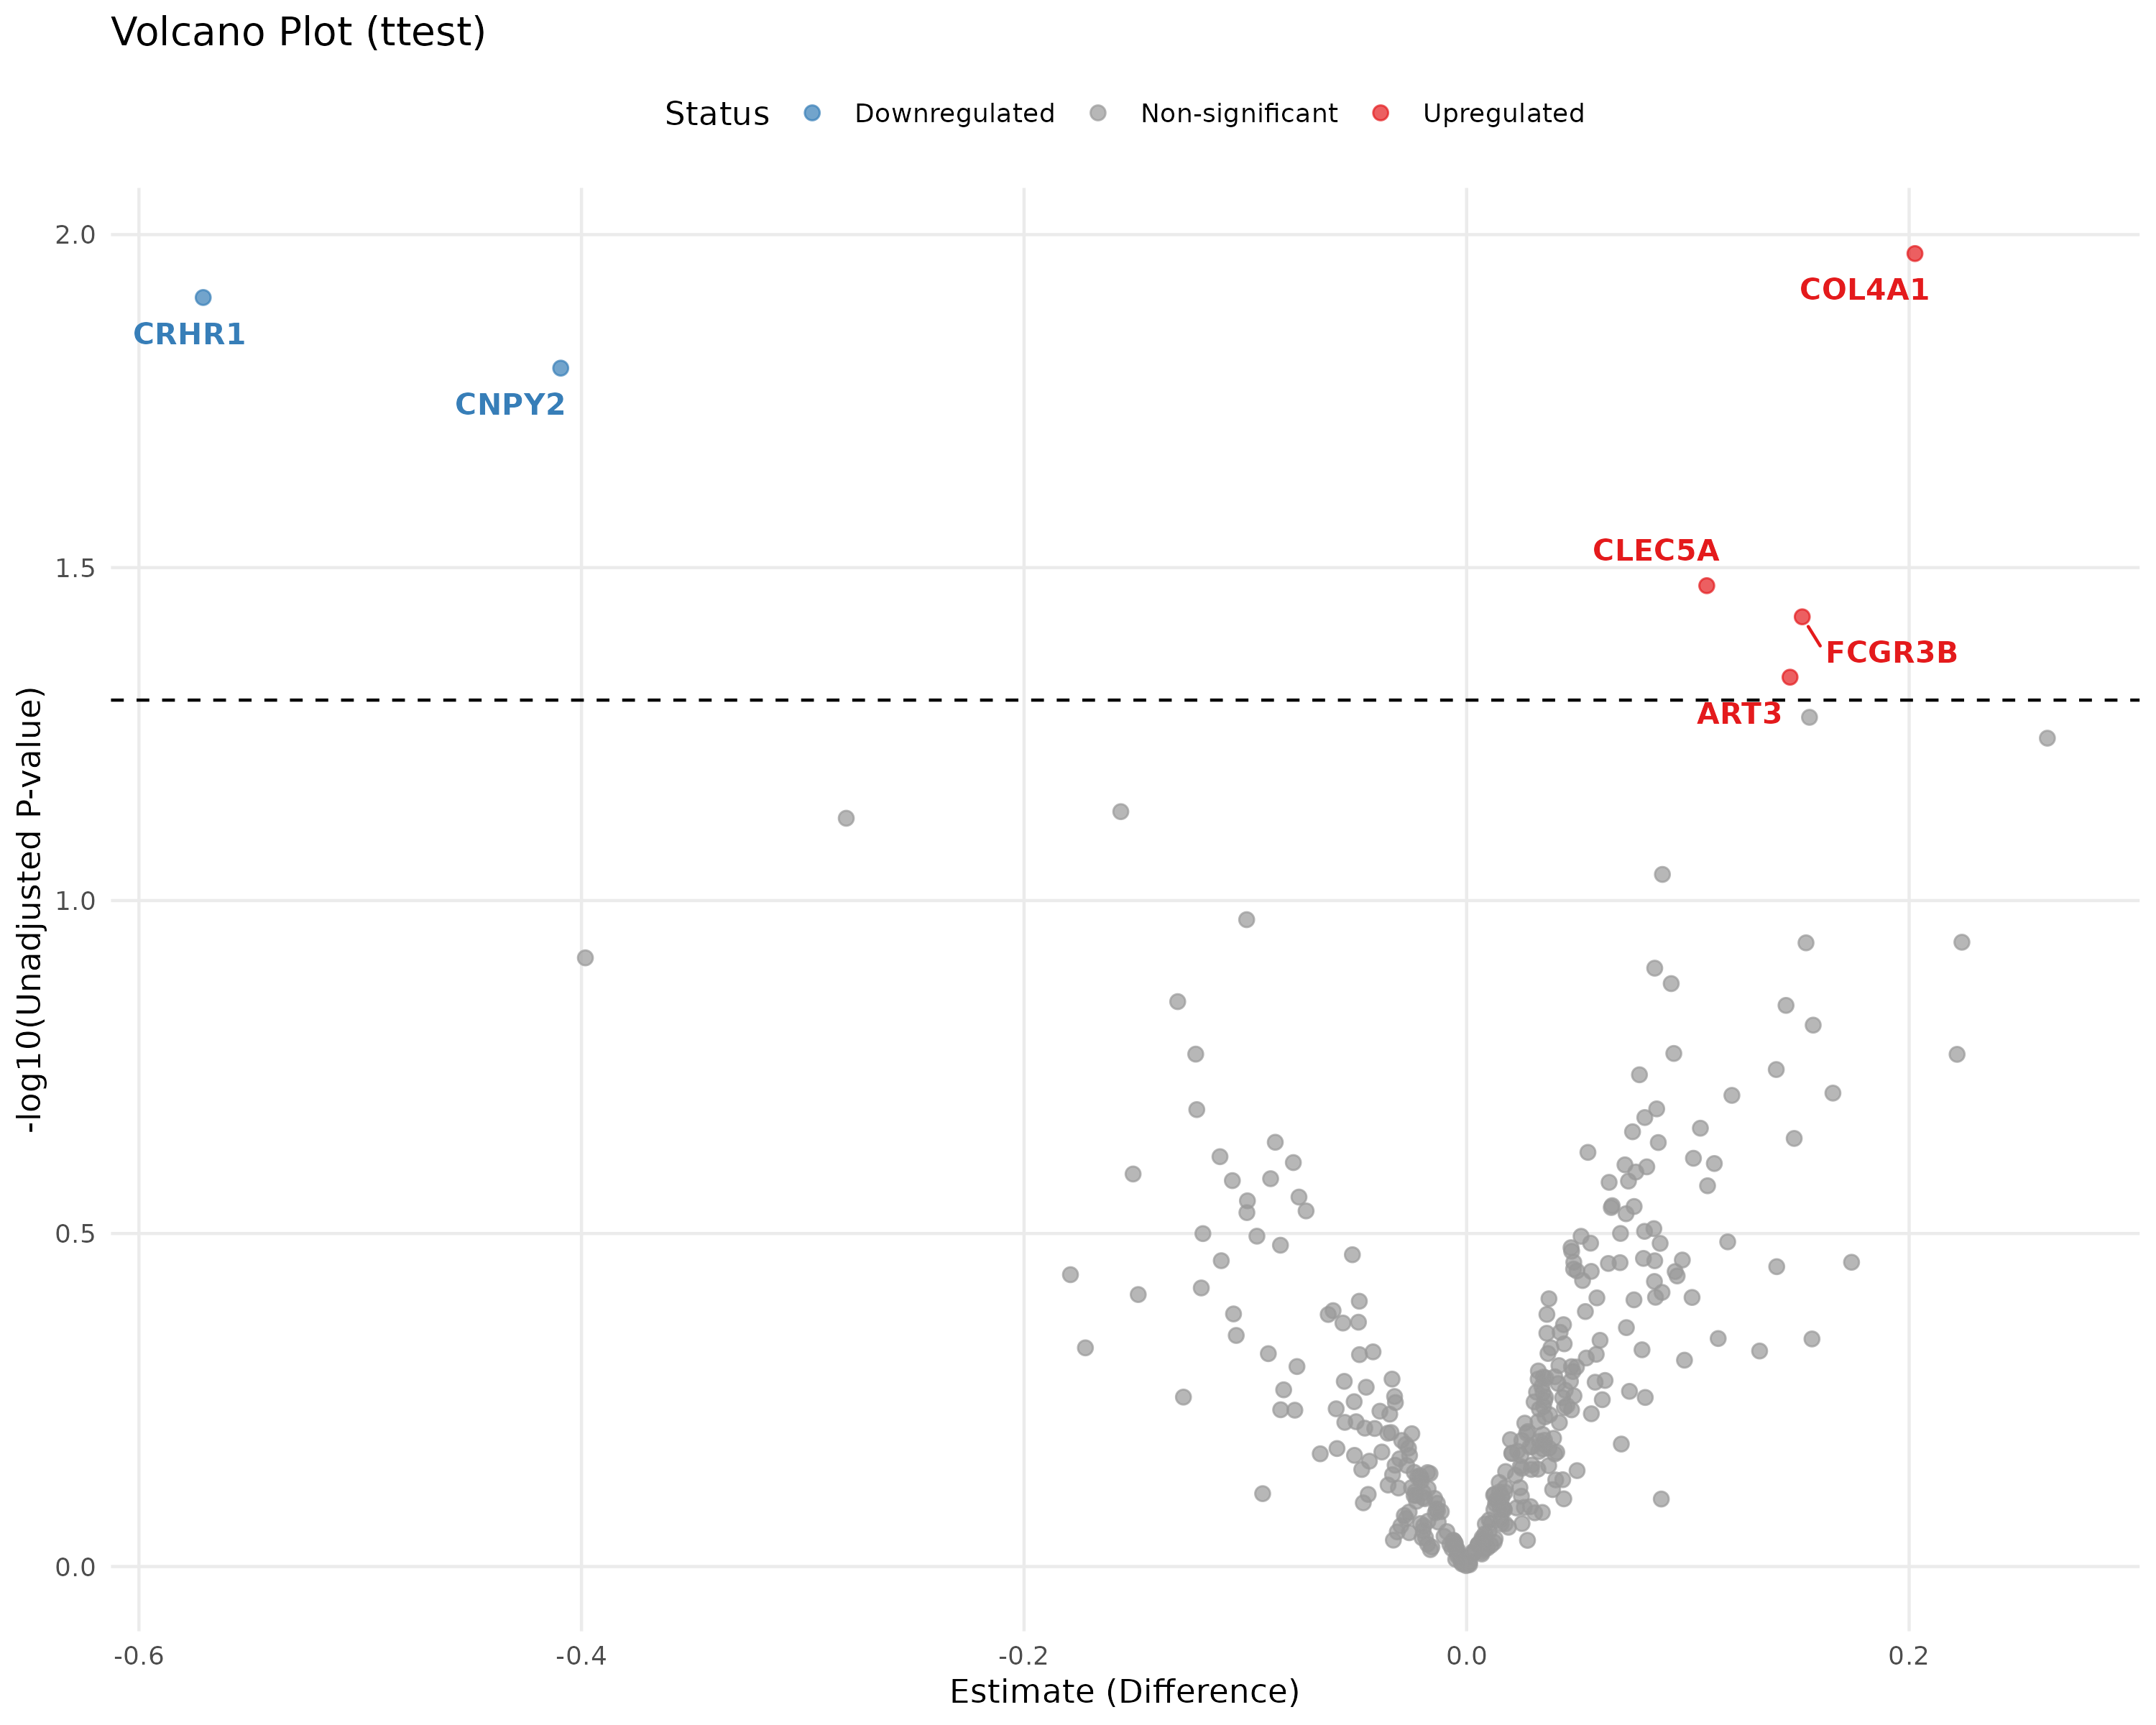
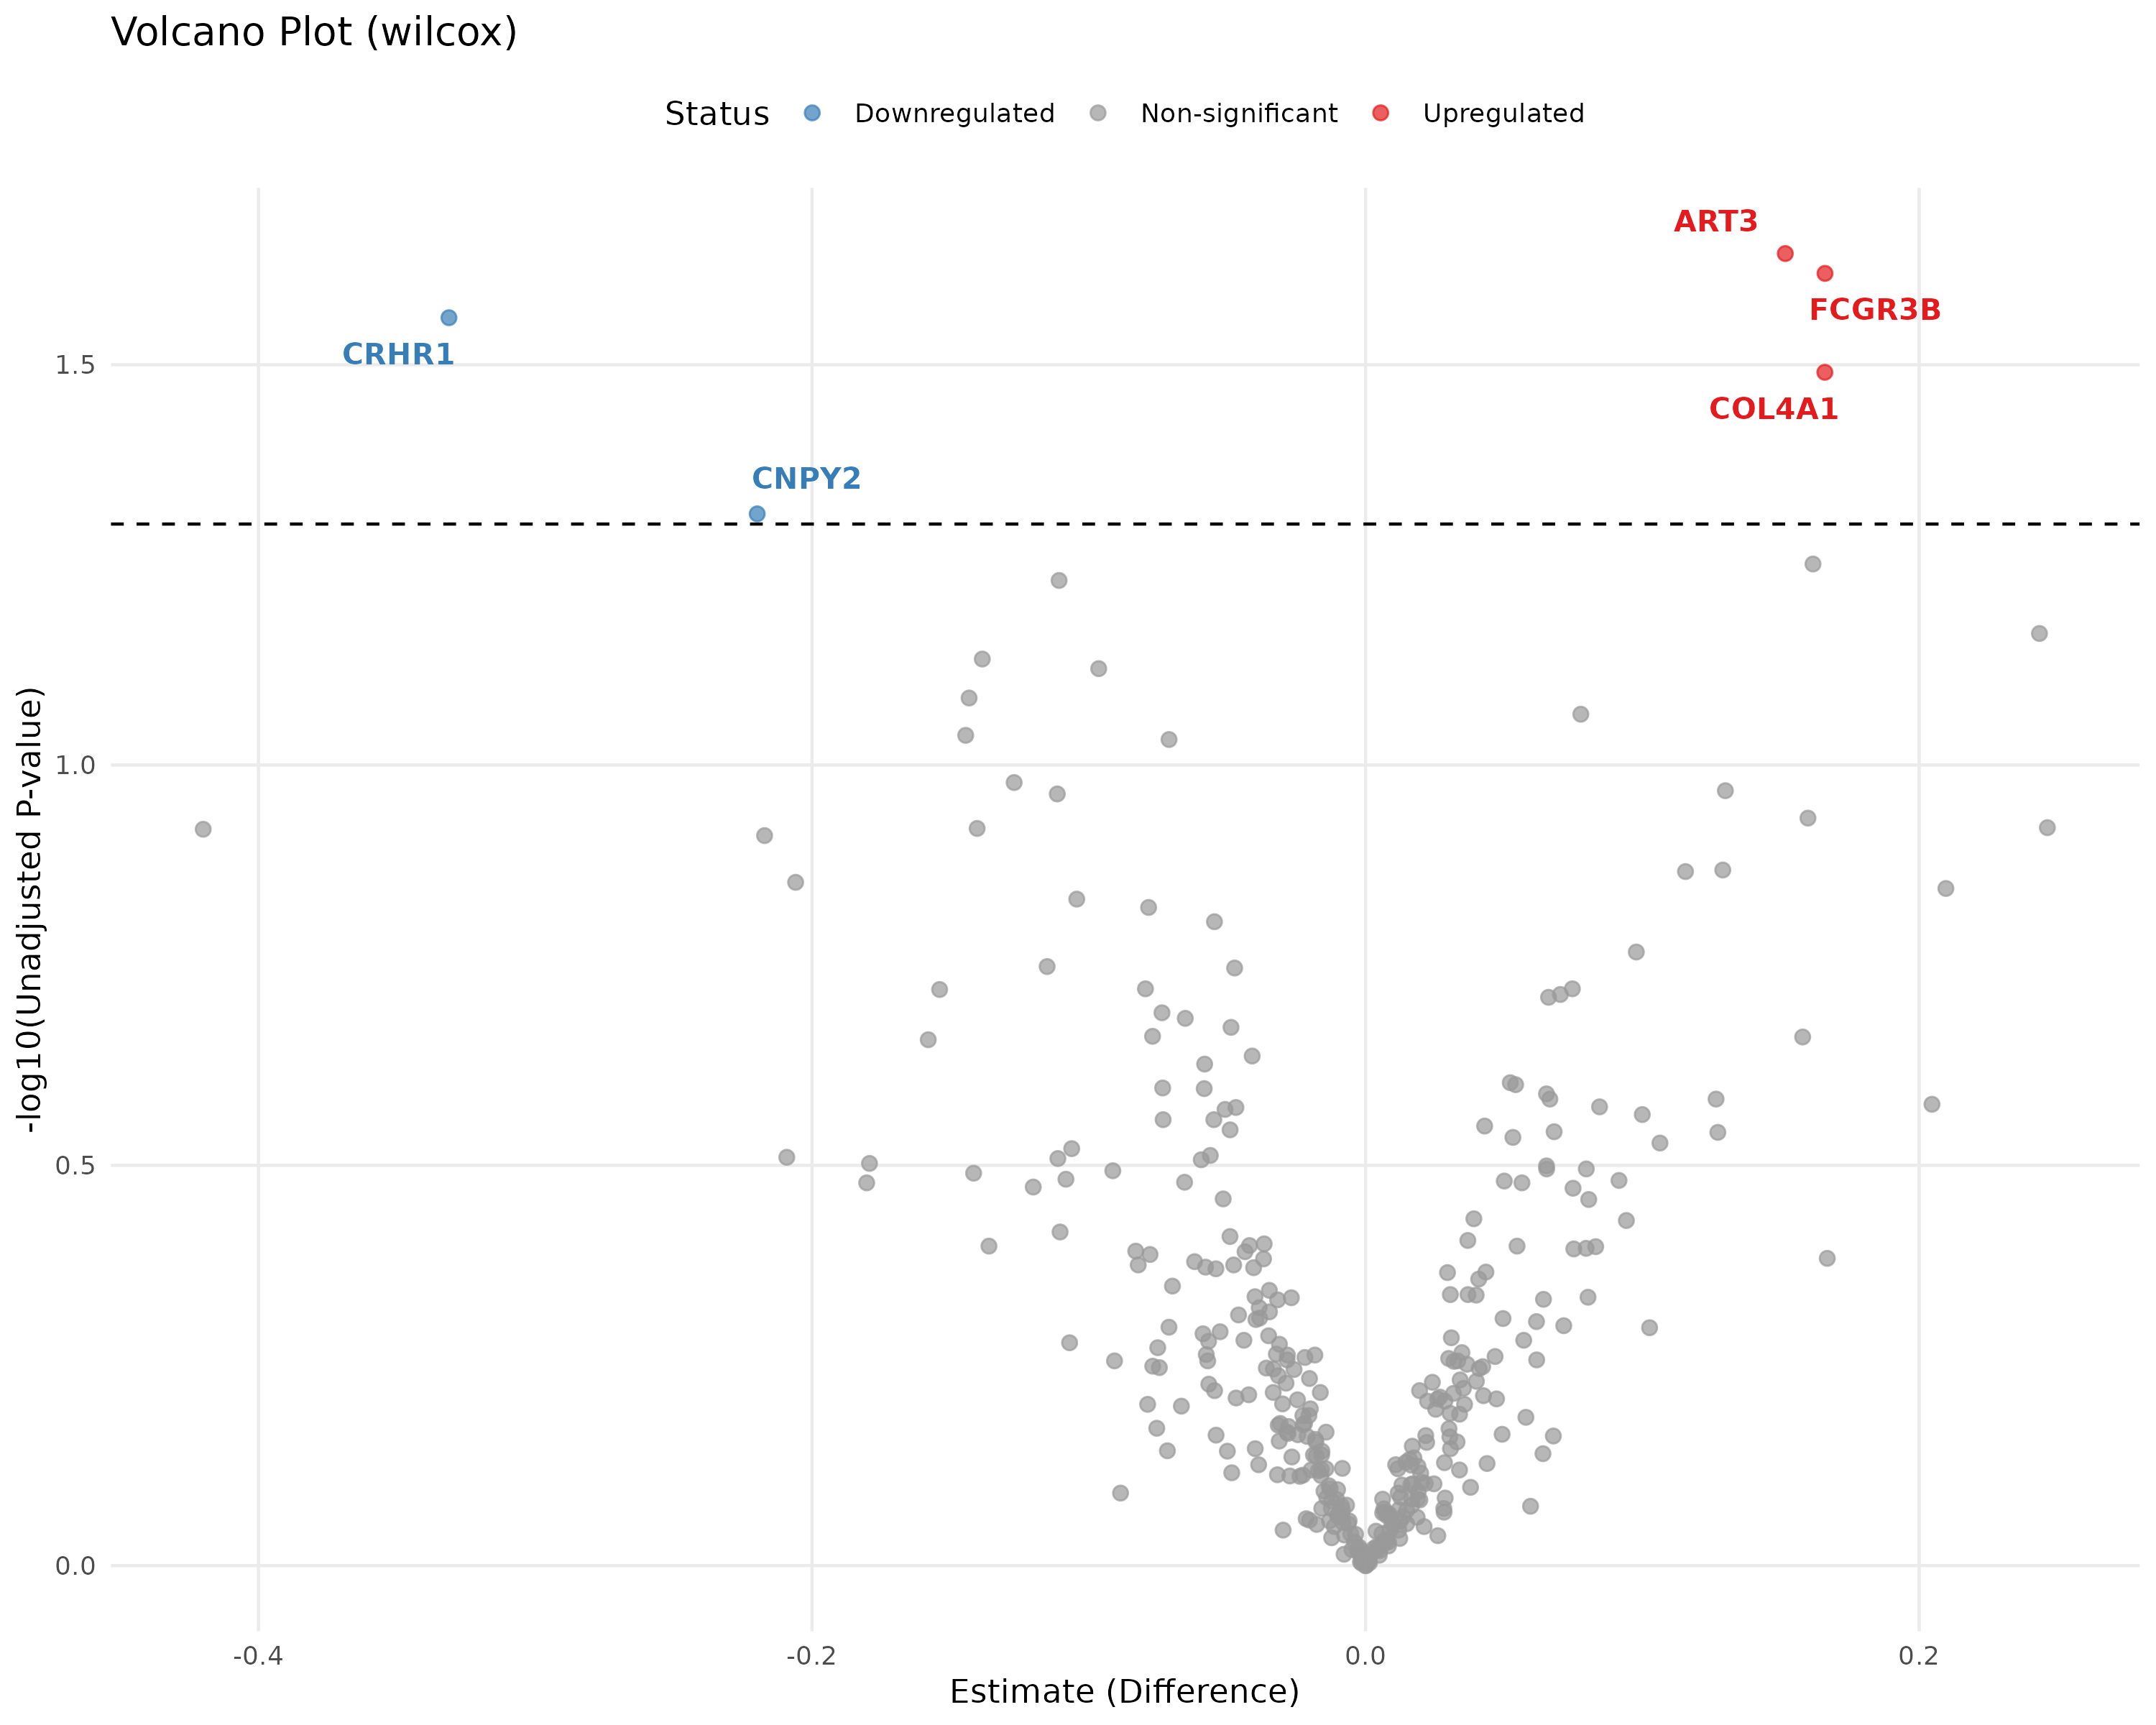
- Logic: Plots Significance (-log10 p-value) vs. Magnitude of Change (Fold Change). Proteins in the top corners are your most robust biomarkers.
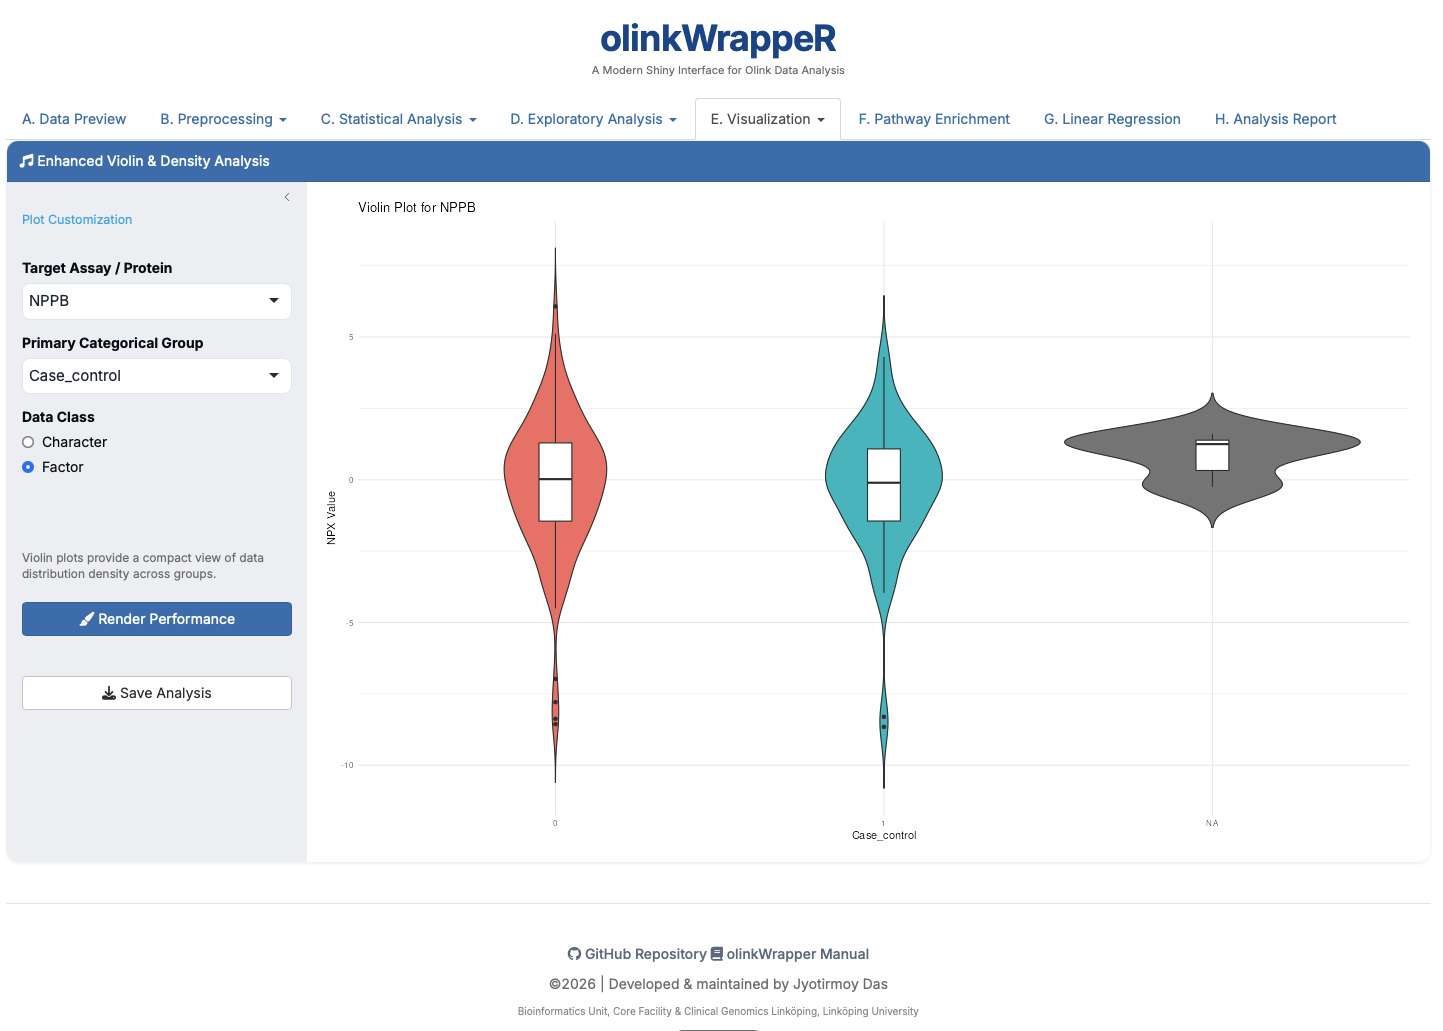
E.8 Violin Plot
Combines a boxplot with a density plot to show data distribution patterns.
F. Pathway Enrichment
Identifies specific biological processes (GO terms, Reactome, etc.) that are over-represented in your significant results.
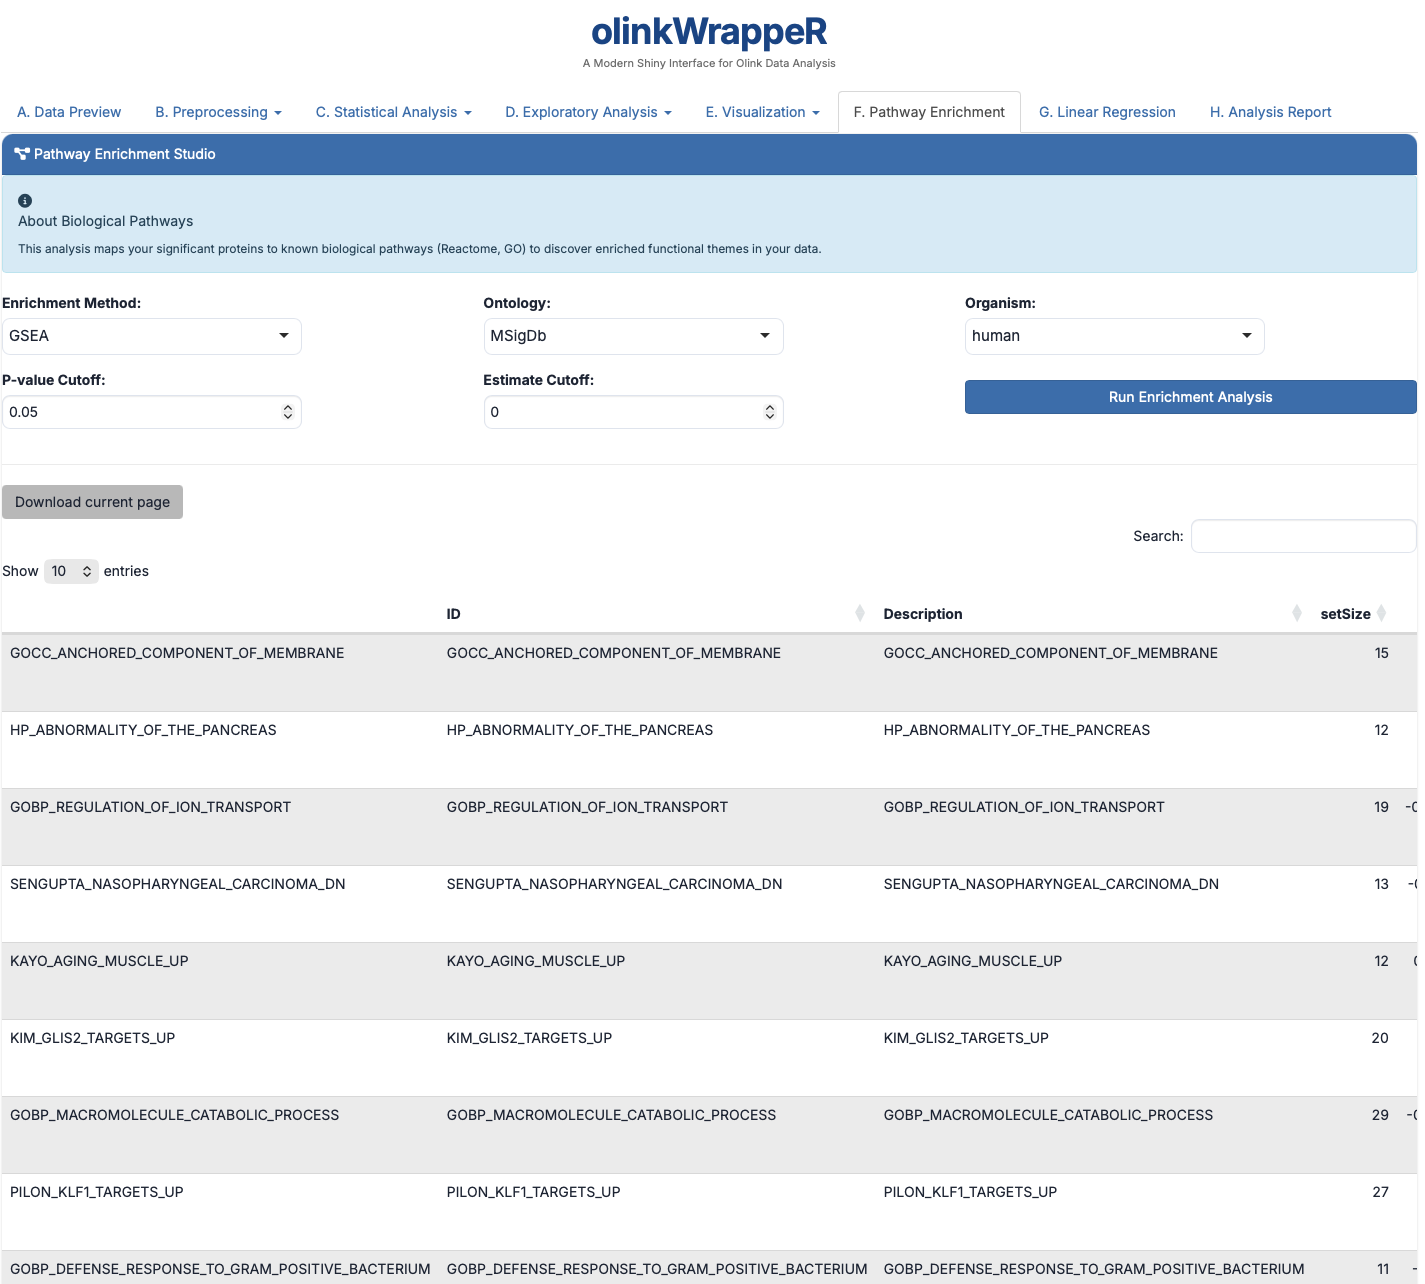
- Biological Relevance: Helps move from a list of proteins to a "biological story."
G. Linear Regression
Statistical modeling of protein expression against continuous variables.
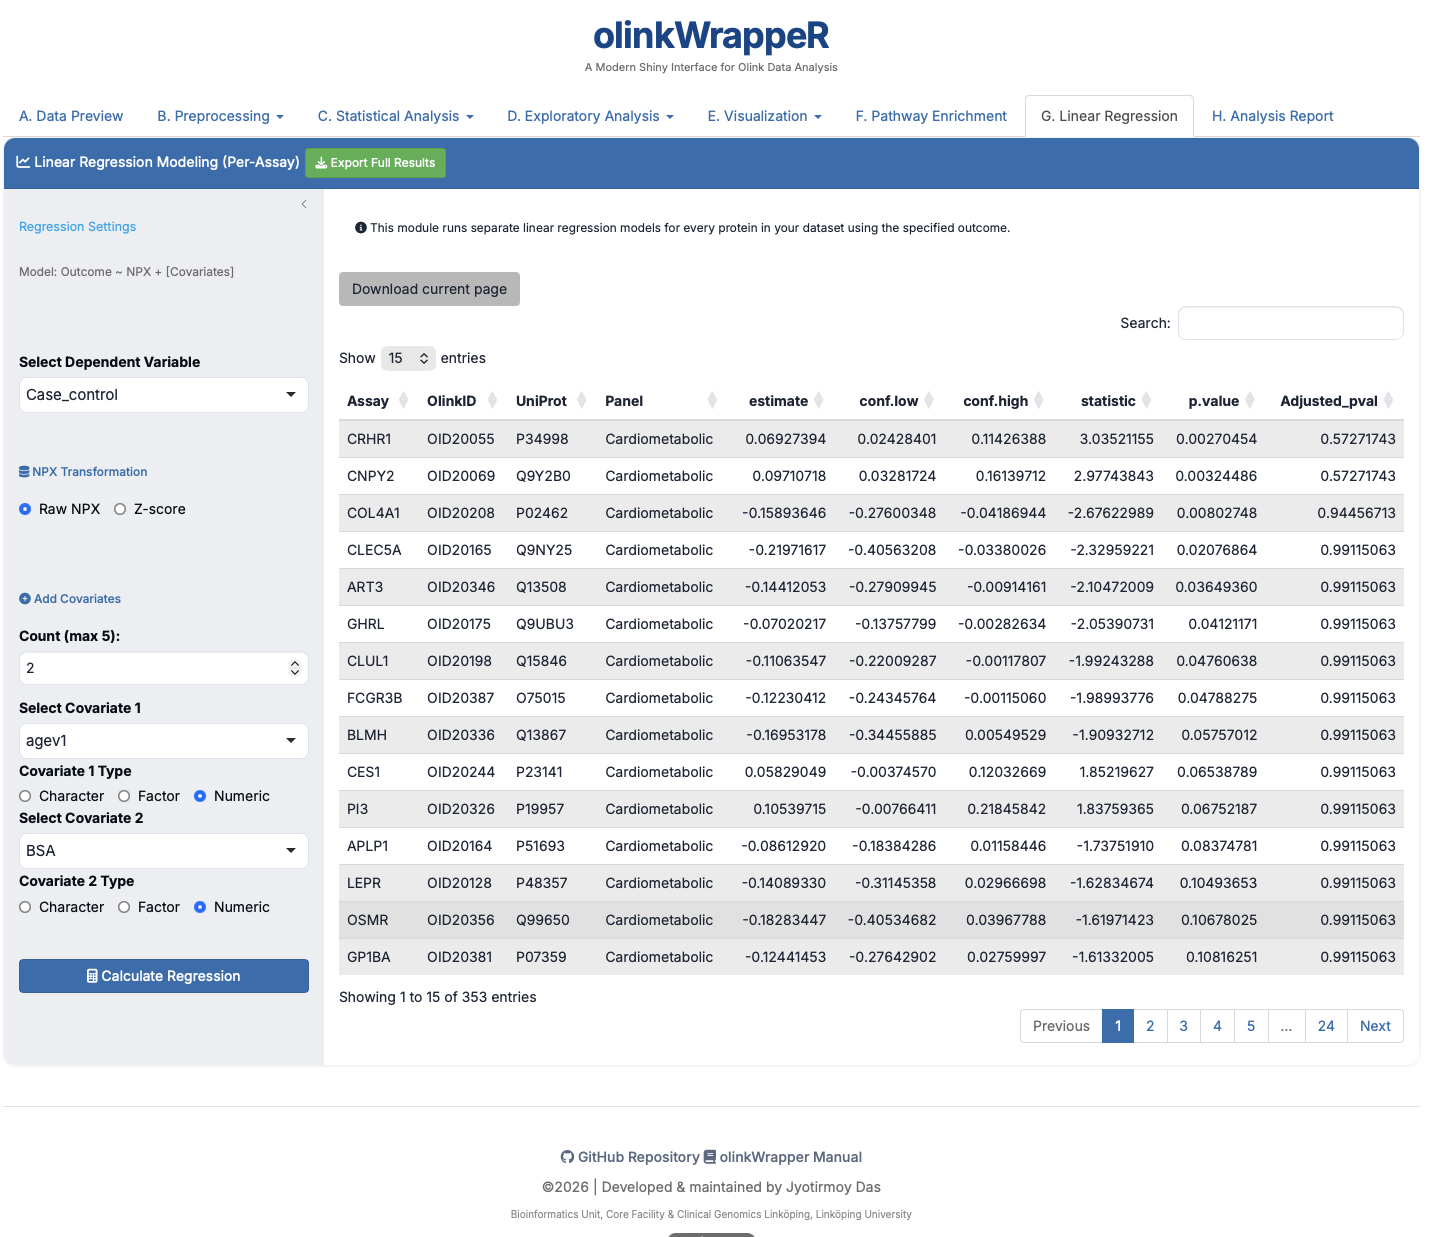
- Interpretation: Assesses if protein levels correlate with factors like Age, BMI, or clinical scores.
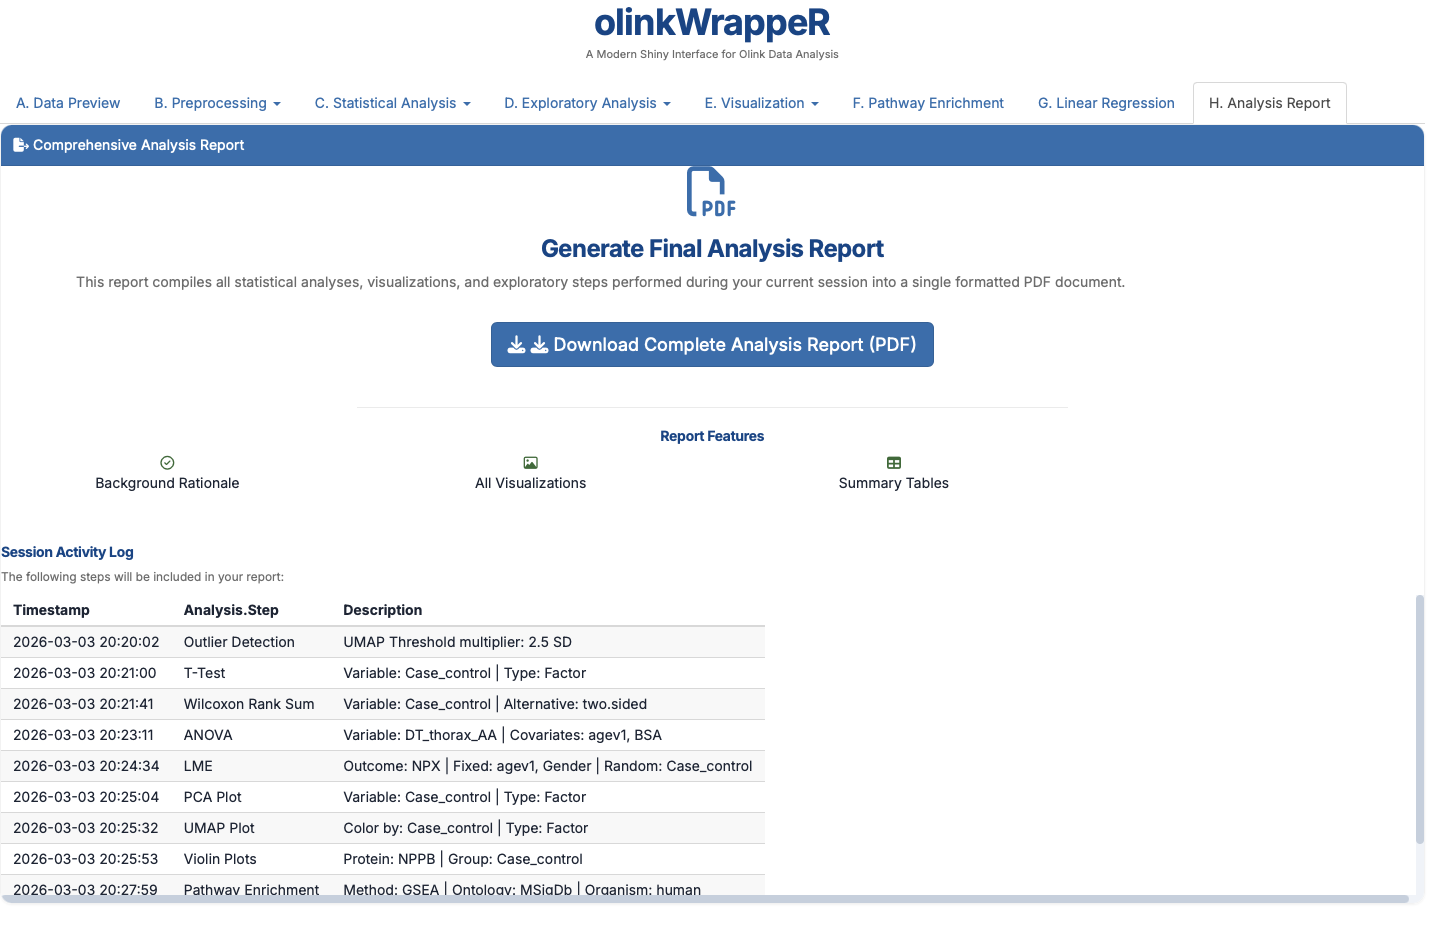
H. Analysis Report
This creates a reproducible PDF file that permanently documents every parameter and every plot you generated in your analysis.